By the middle of 2024, this brand looked like it had figured it out. A premium product line, a loyal customer base, and a clear hero product doing the heavy lifting. Then the dashboard started flashing red.
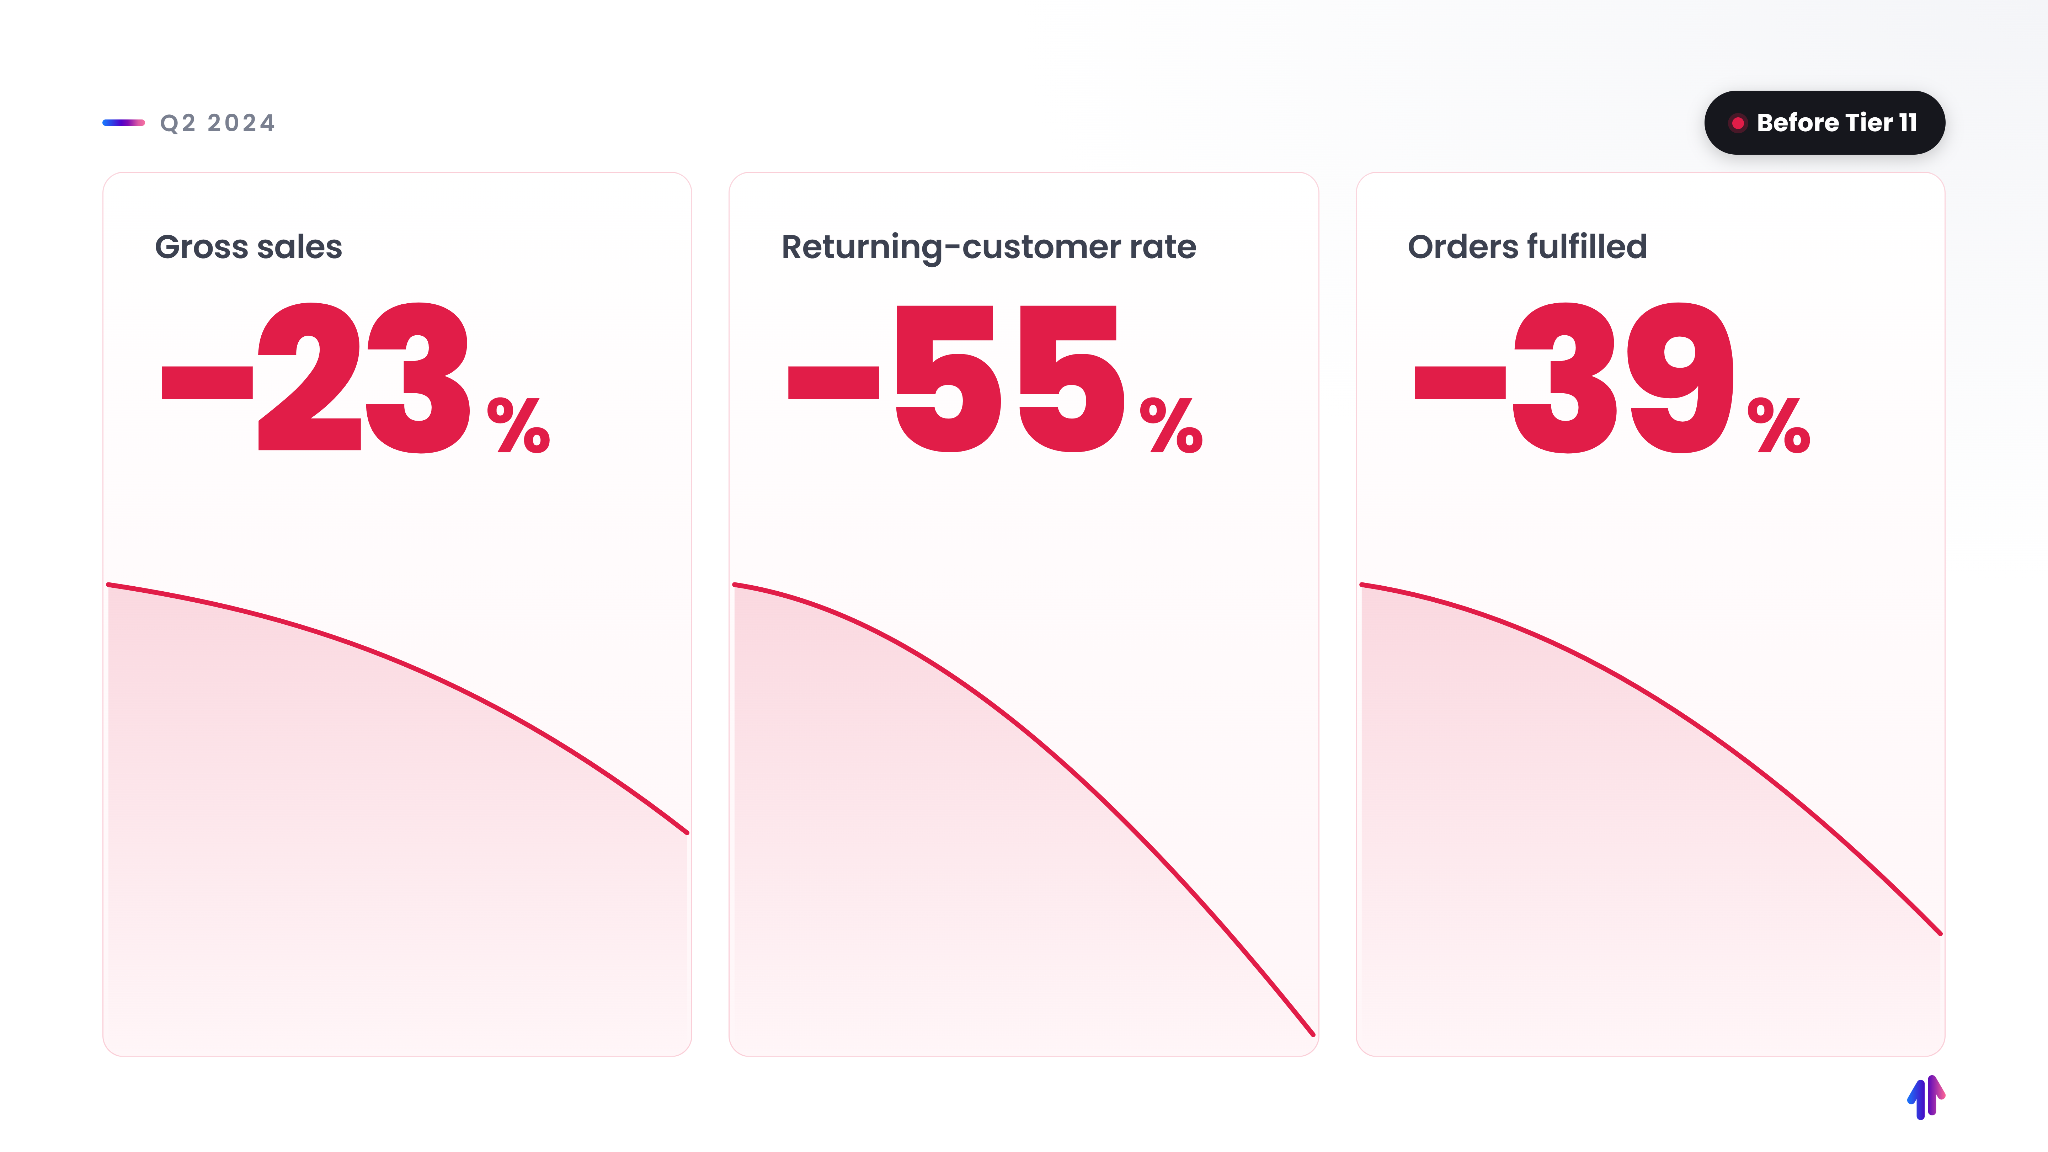
Q2 2024 Shopify revenue was sliding. Gross sales were down 23%. The returning customer rate had fallen 55%. Orders fulfilled dropped 39%. At the same time, the cost to bring in a customer was climbing in the wrong direction: nCAC had risen from $68 in January to $117 by March, and CAC followed, rising from $58 to $93. More spend, fewer customers, a thinner return on every dollar.
So the team did what most operators do at this exact moment. They reached a logical, reasonable, and completely wrong conclusion.
They assumed the problem was the product.
The brand believed its best-seller had hit market saturation, that competitors had crowded the lane, and that the smart play was to spread advertising across more products while pulling back the overall paid budget. Diversify and de-risk.
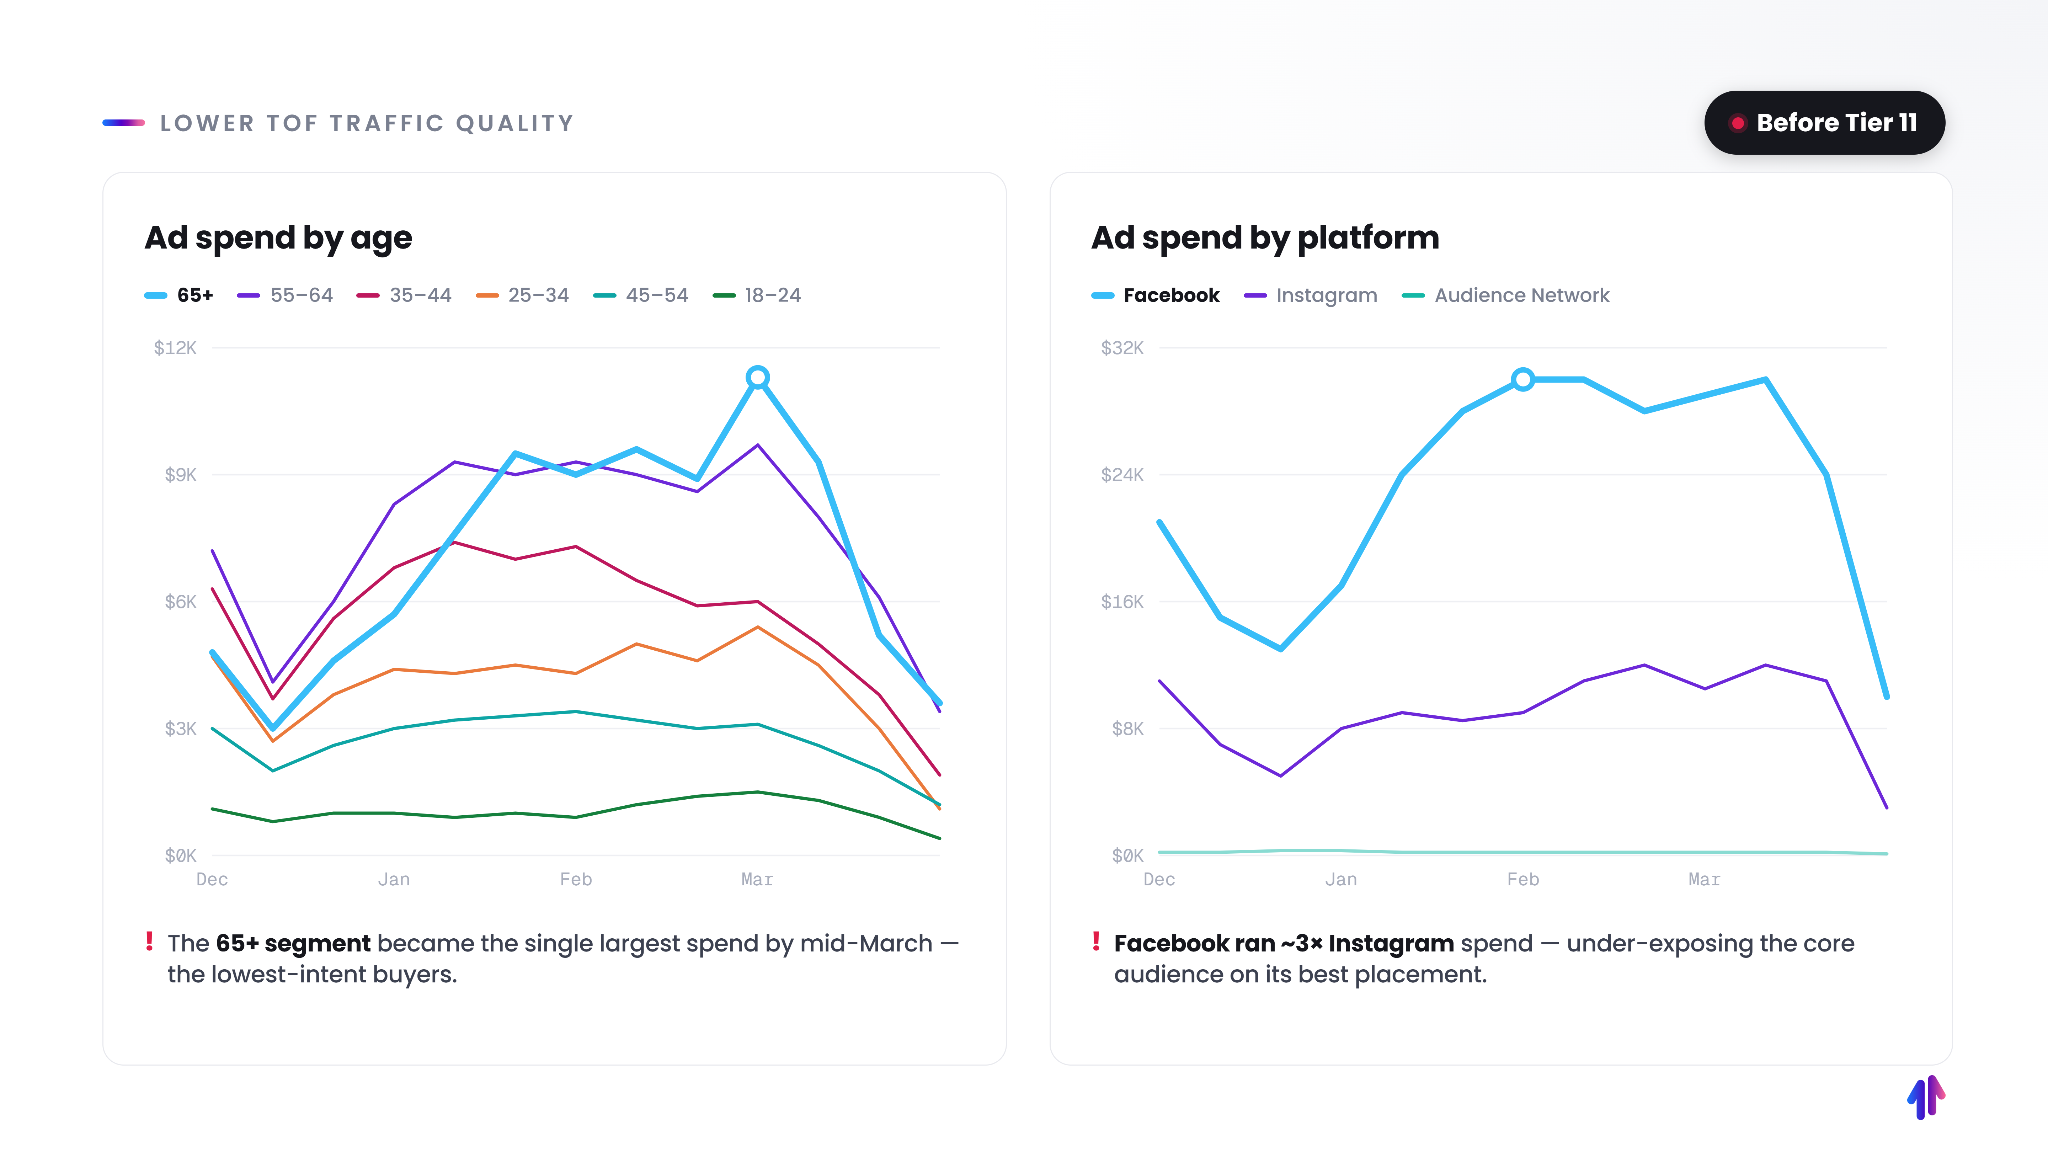
When we looked at the account through the Tier 11 lens, the data told a different story. The decline had nothing to do with demand for the hero product and everything to do with where the budget was actually going.
Put those together, and the picture flips. The brand wasn't saturated. It was being out-managed by its own ad platform. Diversifying the budget and cutting spend would not have fixed that. It would have poured fuel on it.
We ran the Tier 11 nCAC Reducer Framework, which meant doing close to the opposite of the original plan.
1. We capped Meta's age targeting. Instead of letting the algorithm chase cheap 65+ impressions, we used manual audiences to force higher-quality traffic into the top of funnel. Less volume, far better intent.
2. We concentrated the budget on the hero product, not away from it. Even as the client reduced total ad spend by 33%, we pushed traffic straight back to the best seller. The product the team wanted to retreat from became the product we bet on. Sessions to that product climbed 9% on a shrinking budget.
3. We rebuilt the creative from the ground up. This is where Creative Diversification did the work, across three dimensions:
.png)
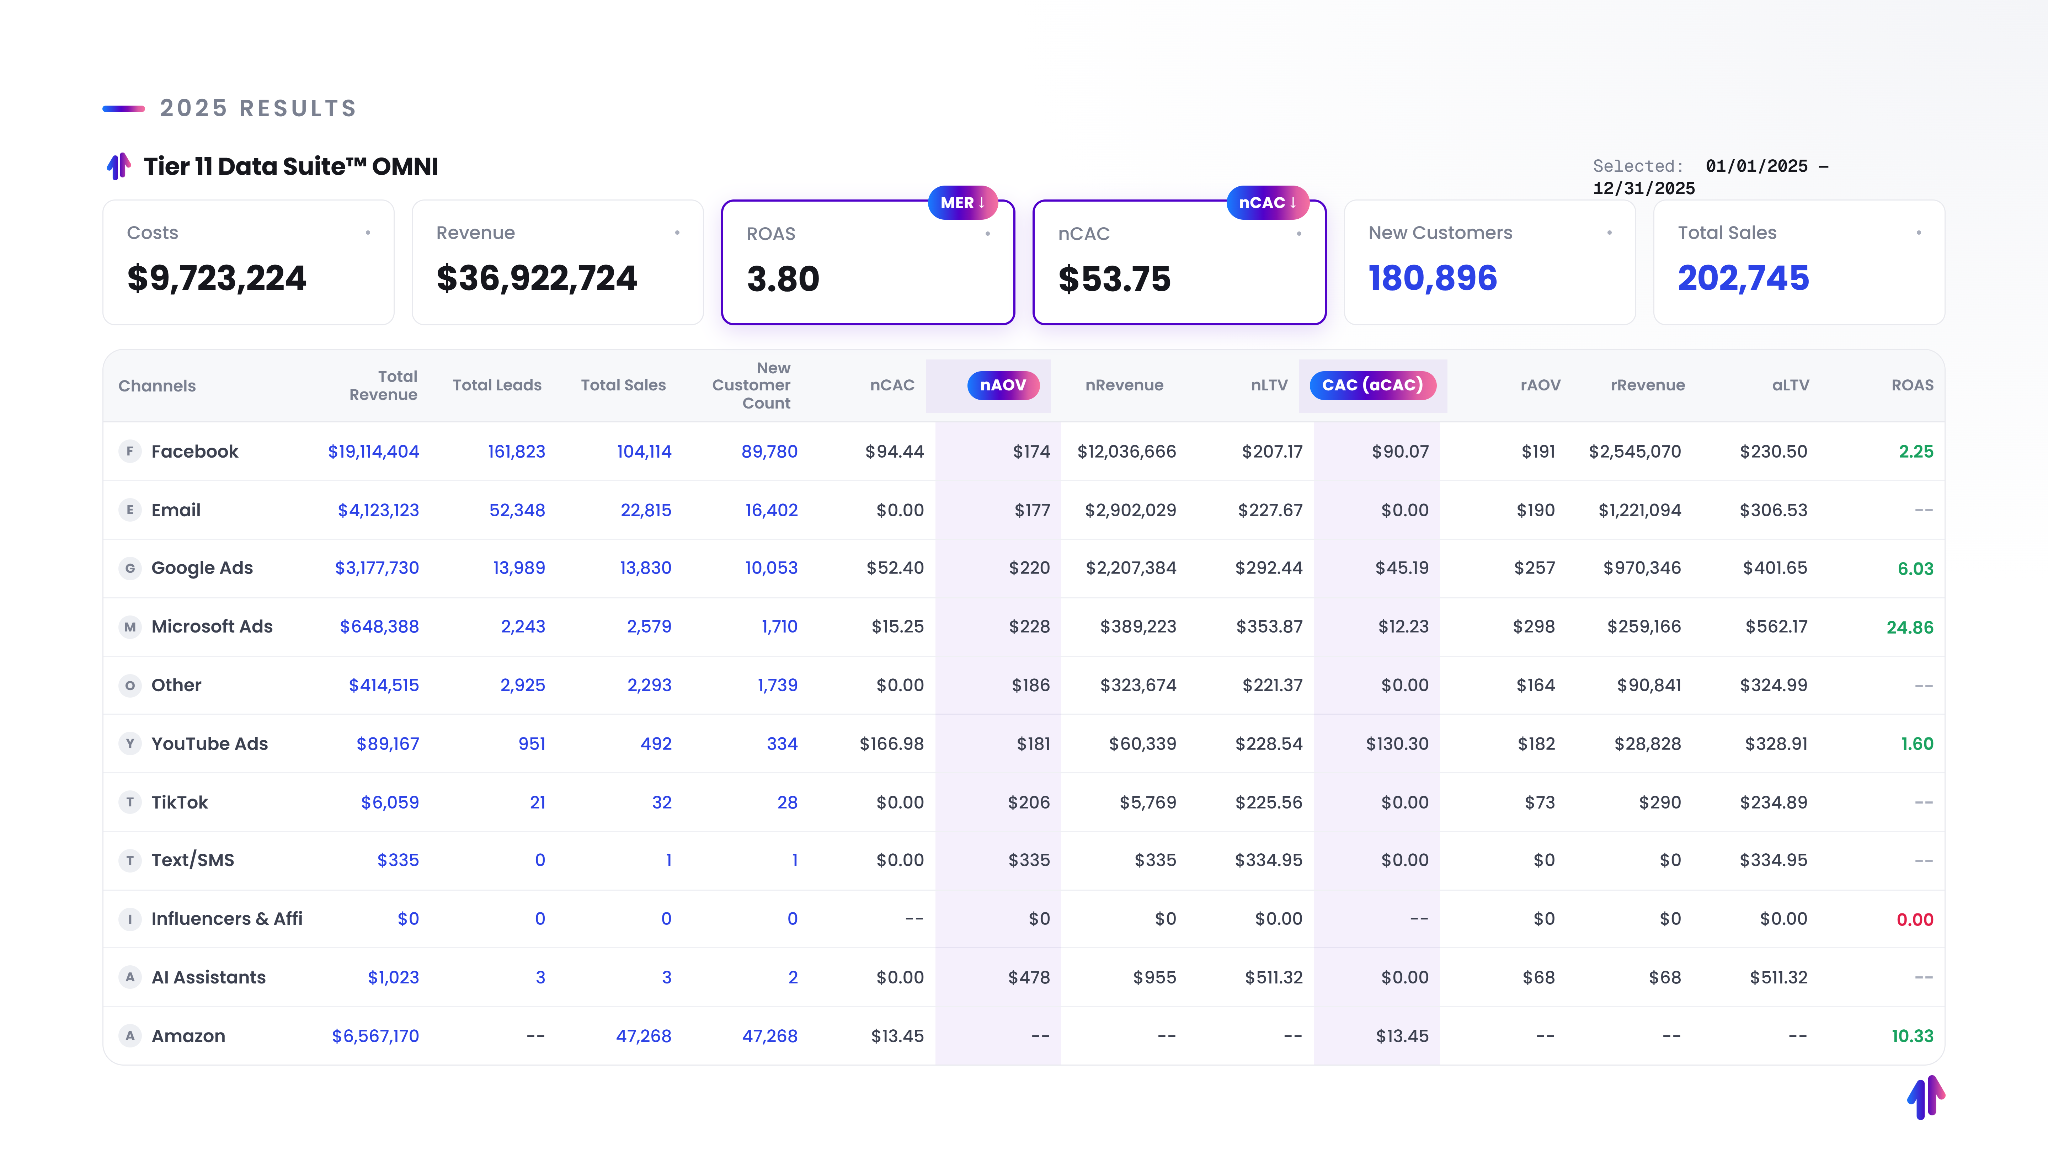
A turnaround you can't measure is just a guess that happened to land. So we ran the whole thing on the Tier 11 Data Suite.
The Data Suite captures the customer journey server-side, at the edge, which means cookie blockers and privacy tools don't blind it the way they blind a standard pixel. That gave the brand a single source of truth: blended topline metrics like nCAC, aCAC (all customer - new and returning), nAOV, and MER (blended ROAS), all monitored together, then benchmarked against in-platform numbers so we could see, in real time, whether Meta's reported cost per new customer matched reality.
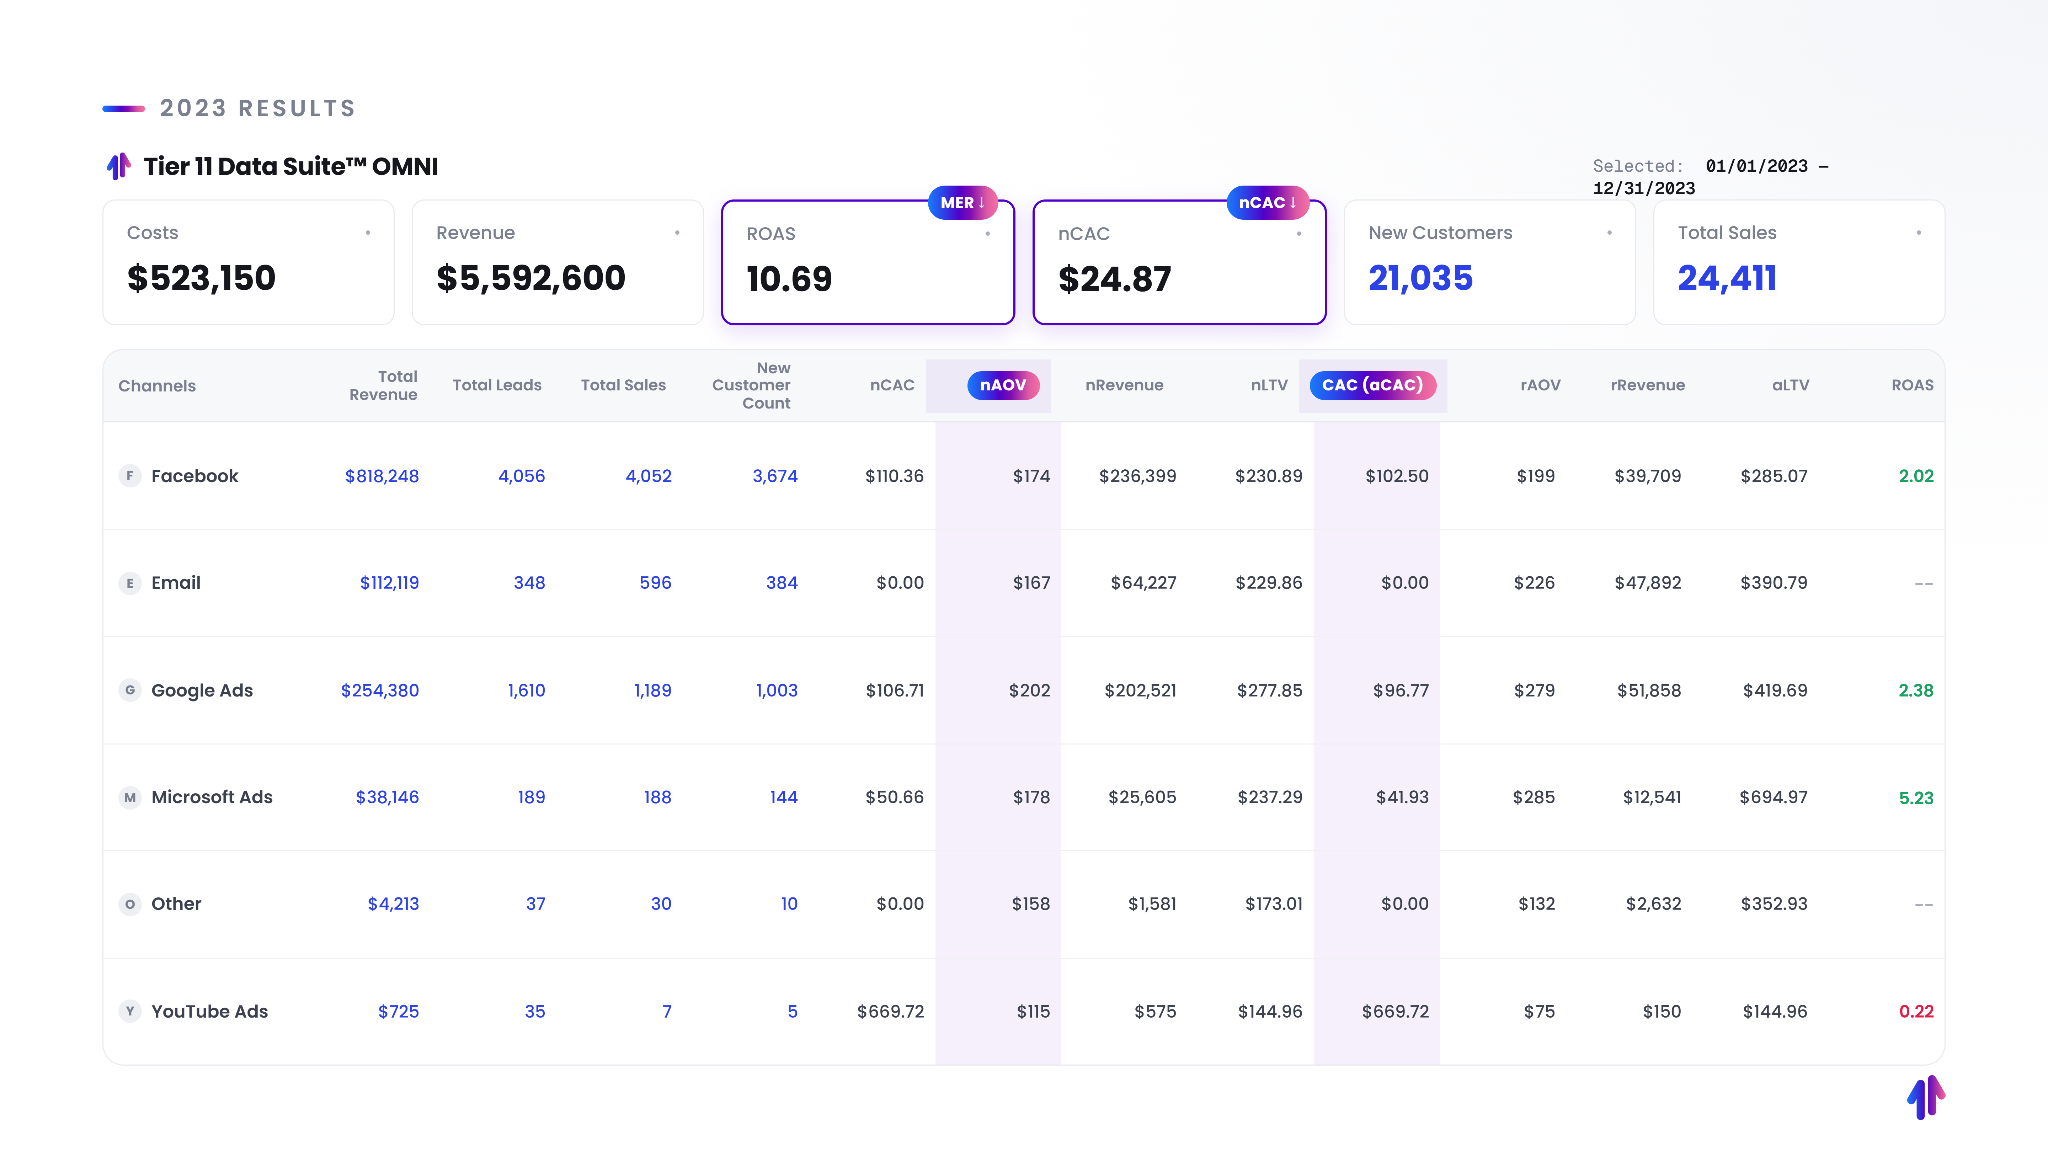
2023 Results:
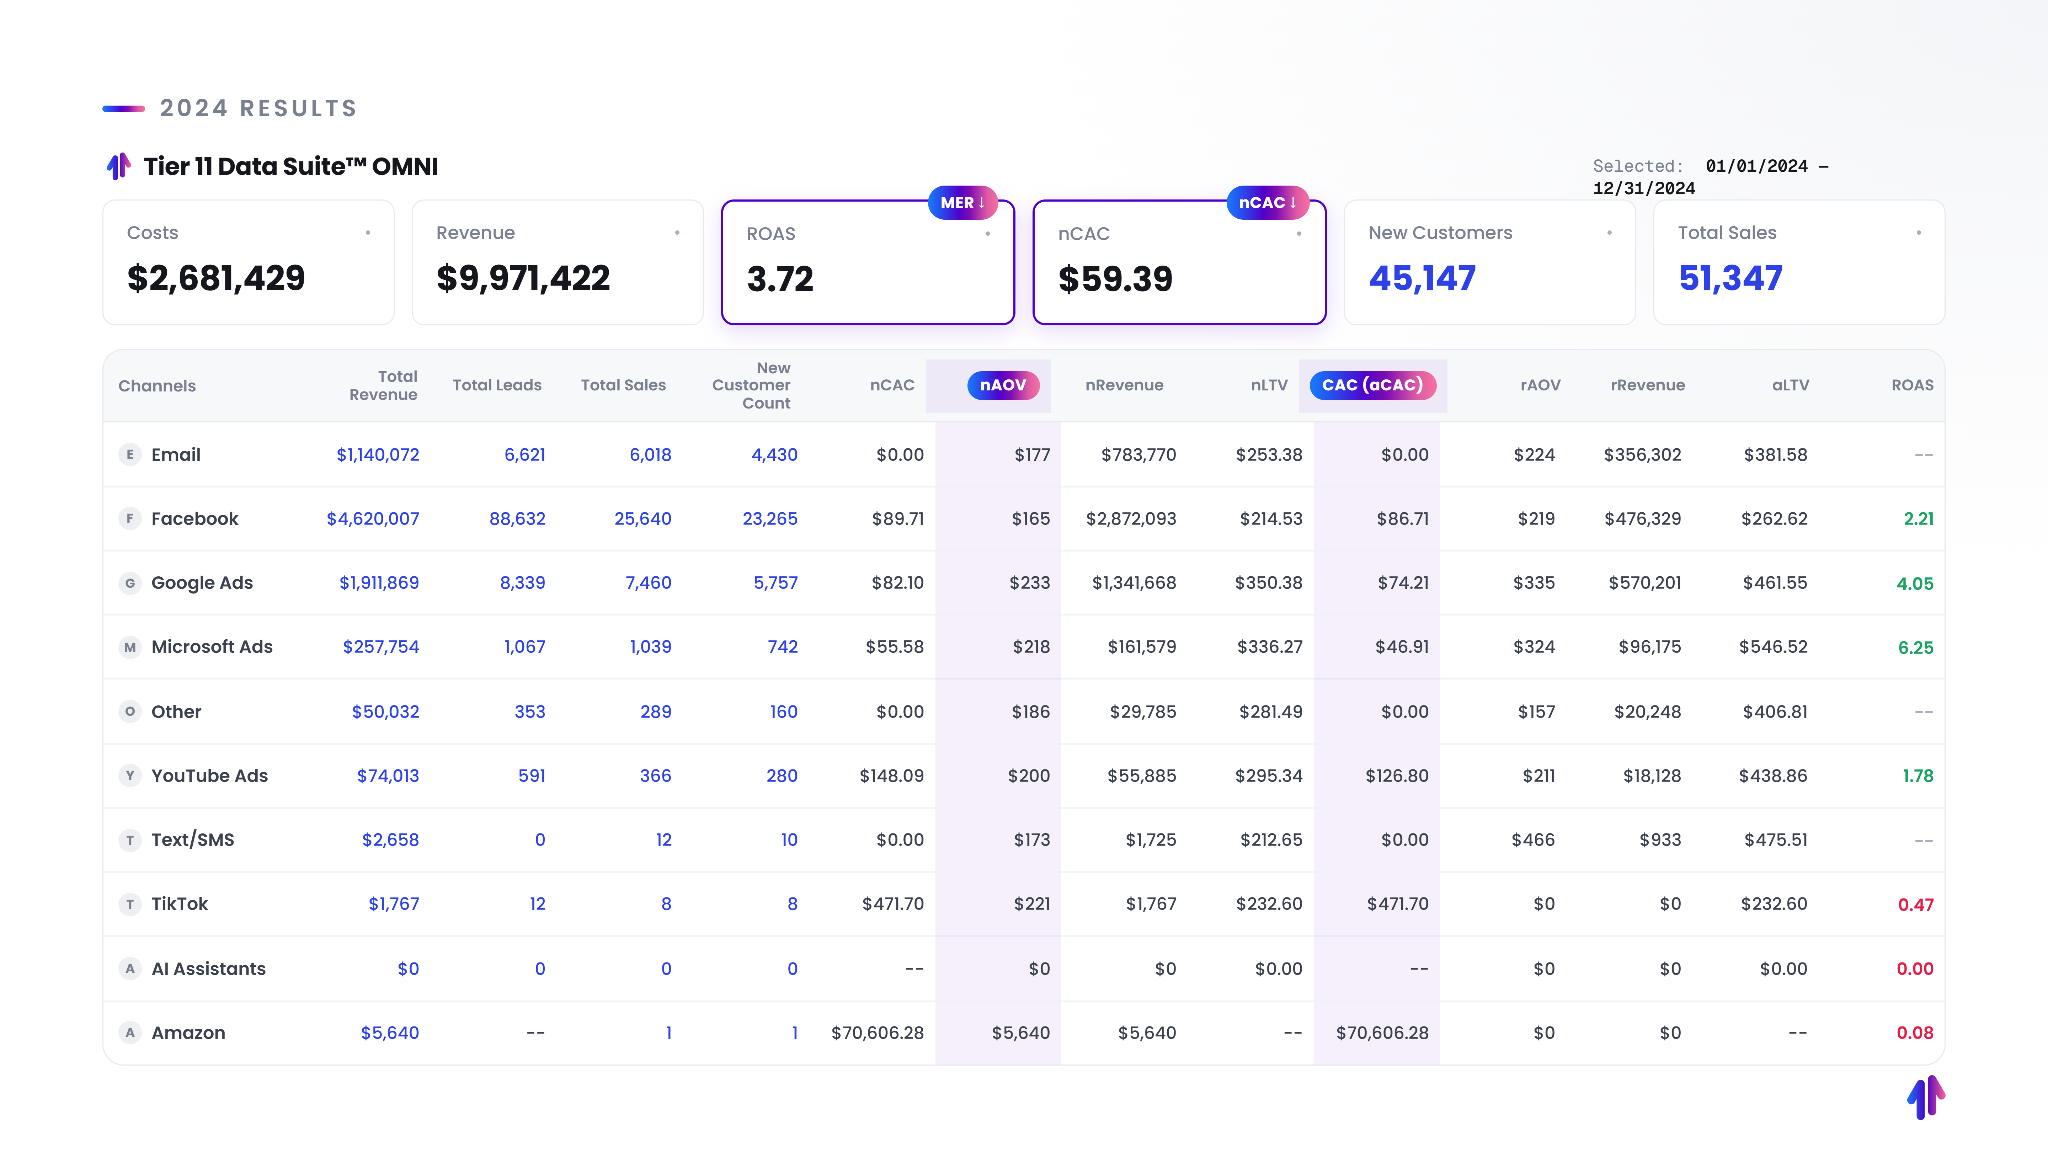
2024 Results:
2025 Results:
It also let us make creative calls on evidence instead of opinion. Using Motion, we scored every asset on hook rate, watch rate, click-through, and conversion, then put budget behind the winners and killed the rest fast. When you can see which creative is actually working, finding one winner can reset your acquisition cost in a single week. It did exactly that: cost per purchase dropped 54%, from $121.39 to $55.74, week over week, and ROAS on that creative climbed from 1.62 to 3.22 once the right creative surfaced.
Within months, the cost curve bent back the right way. By September 2024, nCAC had fallen from its $117 peak to $70, and CAC from $93 to $57. On a smaller budget.
And because the wins compounded across the whole Conversion Engine, the gains didn't stay locked inside Meta. Better creative and cleaner traffic produced a knock-on effect across every channel. The flywheel was turning.
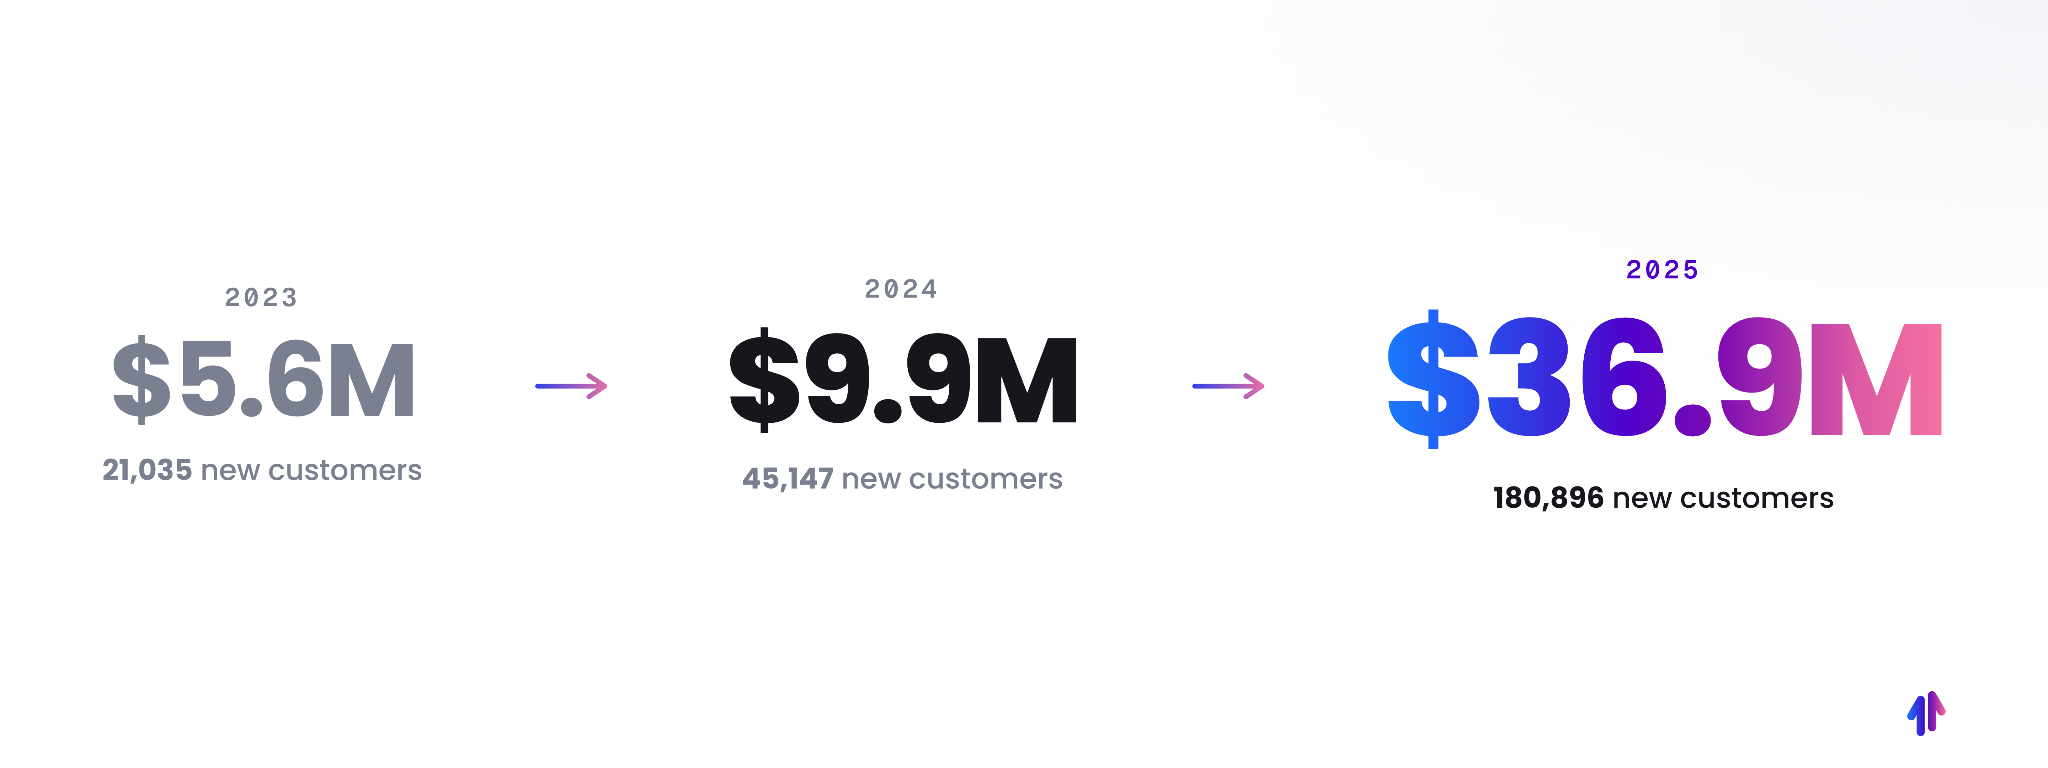
Then it kept turning:
Year | Revenue | New customers
2023 | $5.6M | 21,035
2024 | $9.9M | 45,147
2025 | $36.9M | 180,896
That is 560% revenue growth and 760% more new customers in under two years, while holding spend at around 26% of revenue (a 3.8 MER). The brand that thought it was saturated grew from a $5.6M base to a $36.9M company in under two years, and is now building toward a $50M goal for 2026.
The instinct to diversify wasn't reckless. It was the natural response to a dashboard that looked broken. But the dashboard was measuring the wrong things, and the platform was making the wrong decisions on the brand's behalf.
The growth didn't come from a new product or a bigger budget. It came from forcing quality where the algorithm wanted cheap, concentrating spend where the returns actually lived, building creative that spoke to a real person, and measuring all of it on the Tier 11 Data Suite, which tracked every dollar and every conversion with 99% accuracy. That is the whole job. Most agencies optimize tactics. We fix the system underneath them.
If your spend is climbing while your customer growth stalls, the answer is almost never "spread the budget thinner." It's usually that something underneath is being measured, and managed, the wrong way. That is the conversation we want to have.