Record Month: $1M to $1.6M in 90 Days without spending more.
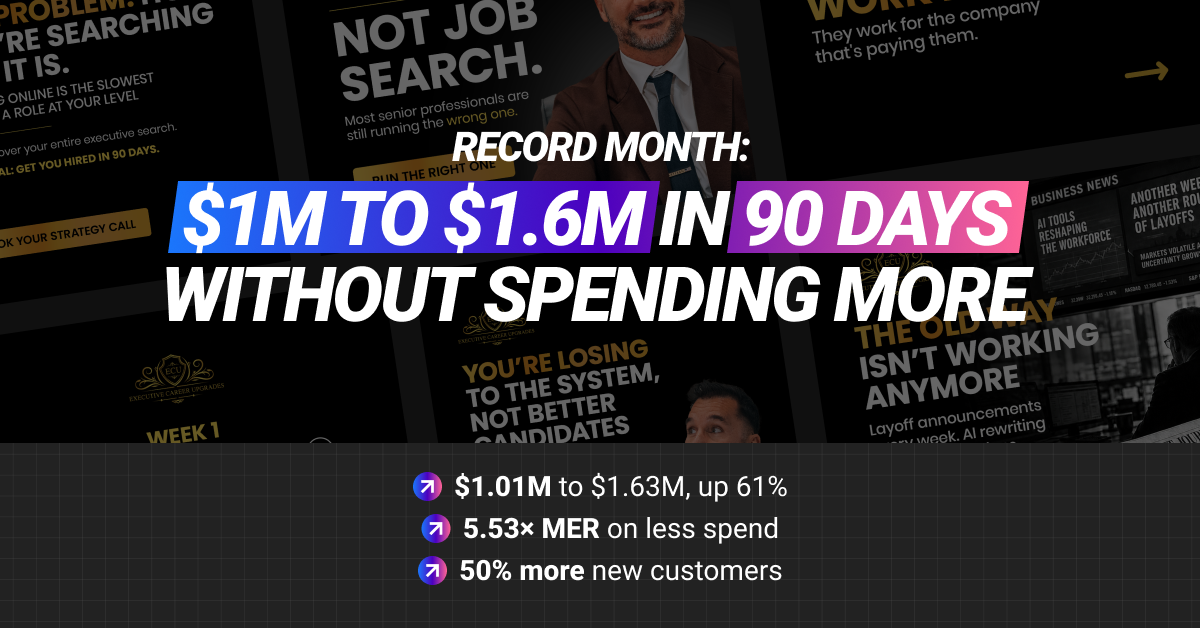
A premium executive career services brand was doing $1.01M a month in revenue when Tier 11 took over its ad accounts. Three months later it closed a record $1.63M month, up 61.4%. Then we made that growth profitable. By September the business was still booking $1.54M a month, 52.4% above where we started, on $137K less ad spend than its record month and at a 5.53× MER.
+61.4% monthly revenue ($1.01M to $1.63M) · +50% new customers · 5.53× MER · +$460K monthly revenue after ad spend
Proof you don’t have to outspend your competition, you have to outthink them.
In March 2026, the month we took over the ads, the business generated $1,008,733 in revenue from 88 new customers. By June it generated $1,628,590 from 132 new customers, its best month on record. By September it held $1,536,890 in monthly revenue while spending $137,180 less than in June, and kept $1,259,186 after ad spend, the most of any month in the partnership through September.
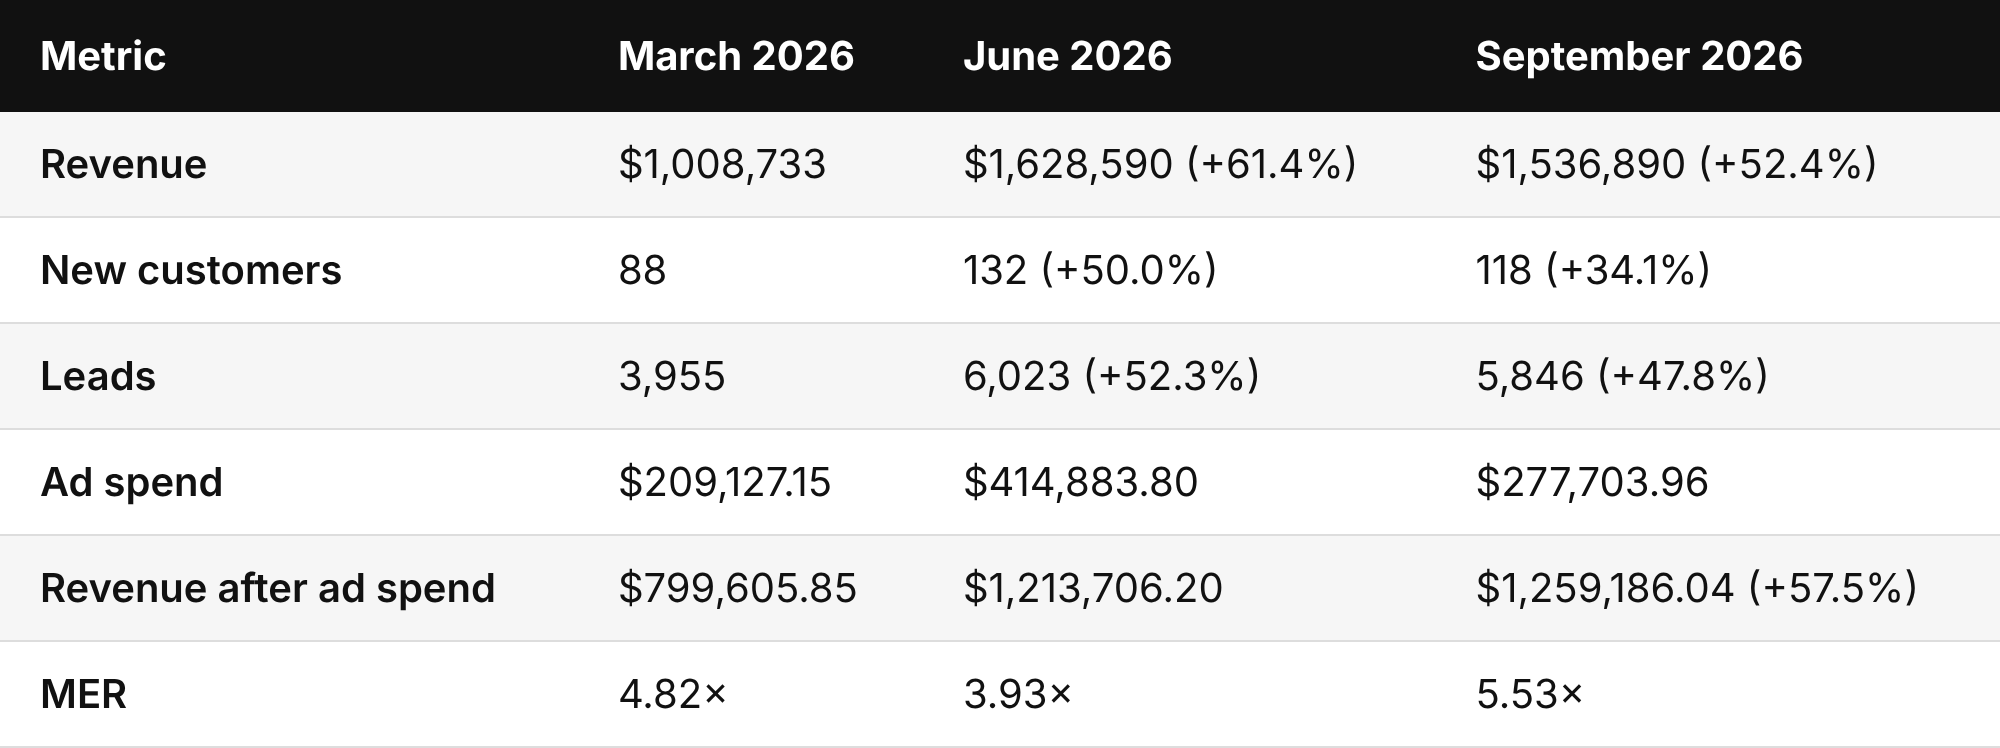
Percentage changes are against March 2026. Source: Tier 11 performance dashboard, all paid channels. We report overall business numbers rather than any single ad platform, because buyers touch several channels before they book. Revenue is CRM deal value. Revenue after ad spend is revenue minus ad spend, not profit: it does not include setter and closer costs, delivery or refunds.
"The team's been crushing it, right? We had our company record last week. We brought in 155 cash in one day. Yesterday was a six figure day… We're at a four point one eight right now. So we're freaking super solid."
The client's founder, in June 2026, to their Tier 11 Growth Strategist.
Record revenue, rising costs
The brand sells a high-ticket, done-for-you career acceleration program to Directors, VPs and executives. Every sale runs through a sales call, so the job of paid media is to put qualified people in front of a setter or a closer.
The growth was real, and so was the cost of it. To reach the record month, ad spend nearly doubled, from $209,127 in March to $414,884 in June. Cost per booked call rose from $134.66 to $232.30, and MER fell from 4.82× to 3.93×, below the client's 4.1× break-even. Revenue was at an all-time high, but each new dollar of it cost more to buy.
The natural read was that ads had gotten expensive at scale and the only lever left was to keep feeding them. We looked After-the-Click and found the real problem:
- Booked calls were not becoming conversations: in June only 33.87% of booked calls showed up. Paid media was filling calendars, and two out of three slots went unused.
- Leads were waiting: the team had added eight setters, then lost closers mid-summer. Calls double-booked, more than 100 setter calls went unanswered, and July MER dropped to 3.11×. Every one of those leads had already been paid for.
Speed to lead is where this pipeline was won
The minutes after someone fills out a form decide whether they become a sales conversation. Ralph Burns and Thomas McNaught made this case on Perpetual Traffic: if your funnel has a book-a-call button, response speed sets your media efficiency, your booked calls and your MER. It is the same message as our post, Why 'Speed to Lead' Breaks or Makes Your Pipeline.
This account proved it. When spend outran the sales floor, leads sat waiting and the money behind them was wasted. The answer was not to stop generating leads. It was to make sure every lead reached a person fast, and to never buy more leads than the team could call back.
What we changed
- We moved budget from direct booking to lead ads. On July 8 we shifted $1,500 a day out of direct call-booking campaigns and into lead ads that drop prospects straight into the setter pipeline, so the conversation starts while intent is at its peak, before a closer's calendar is involved.
- We kept creative fresh without destabilizing delivery. Our evergreen creative slate was built around the founder's own voice and the objections his sales team heard on calls, and released in batches rather than all at once.
- We matched spend to sales capacity. We held budget at $11,500 a day through July while new closers onboarded, and in September, together with the client, set it at $8,000 a day to match the closers on the calendar. The team could call back the leads we bought while they were still warm.

July 8 budget change history: $1,500 a day moved out of two campaigns and into the two high-intent lead ad campaigns.
Same budget, more conversations
The clearest proof is two months with almost the same budget. May and August were within 5% of each other on spend, and August delivered cheaper leads, cheaper calls and 160 more shows.
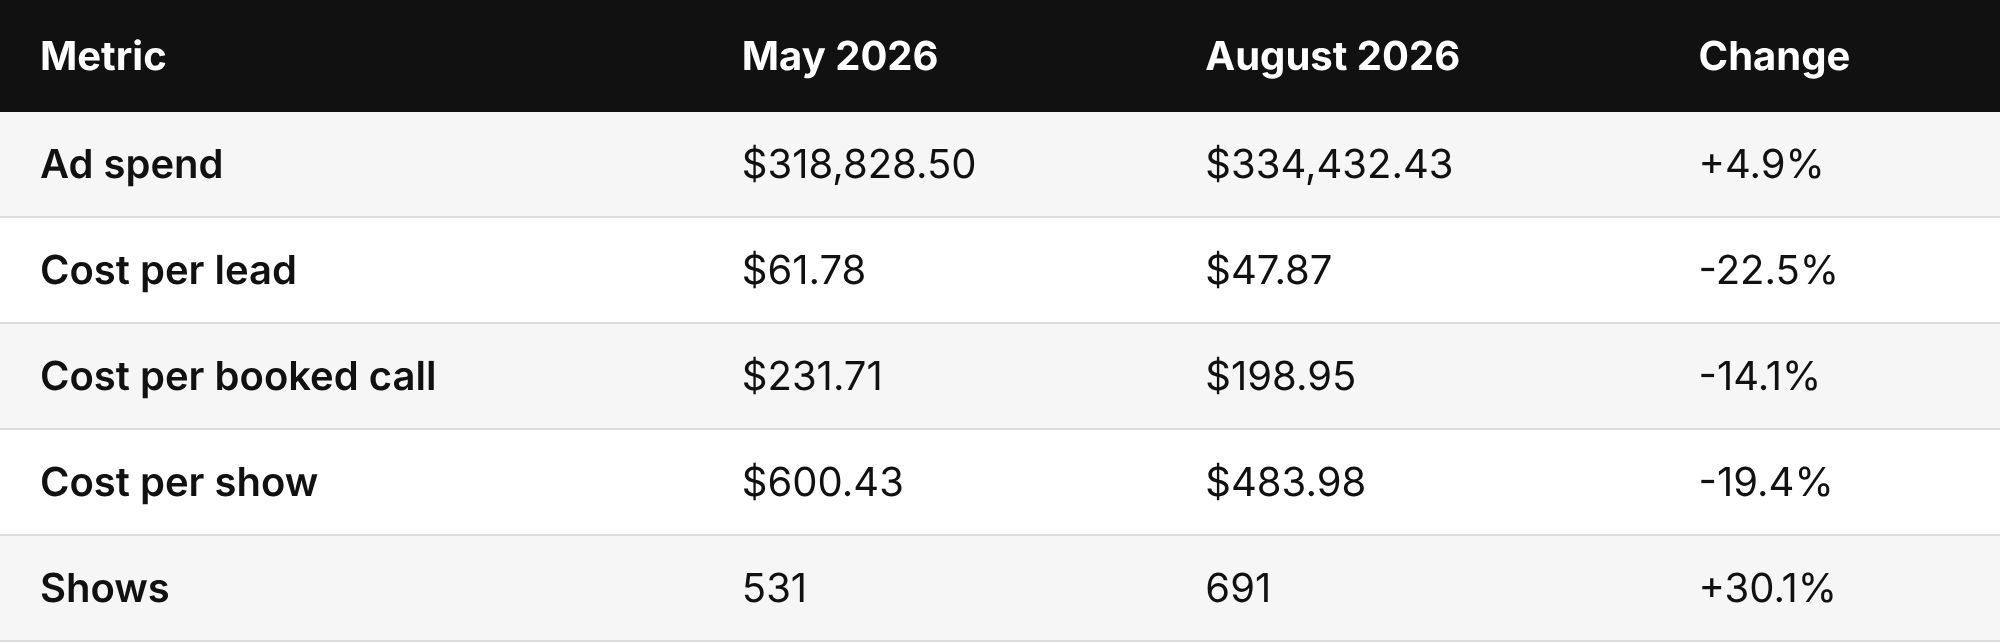
The show-up rate climbed too: 41.11% of booked calls showed up in August, against 33.87% in June. That is speed to lead at work. Prospects a setter reaches while they are still warm turn up for the call.

Lead-to-booked-call and booked-call-to-show rates by month, across all sources. Source: Tier 11 performance dashboard. We track show-ups across every source rather than by last click, because a buyer who first saw a paid ad may book after a later touch.
August put 160 more people in front of a closer than May for roughly the same money. What held revenue back was closer capacity, so the next move was to size spend to the team.
Record-level revenue, now profitable
In September, with spend set to closer capacity and leads reaching a setter fast, the funnel gains reached revenue. The business booked $1,536,890, within 6% of its record month, on a third less ad spend. MER rose to 5.53×, nCAC fell 25.1% to $2,353.42, and revenue after ad spend hit $1,259,186, the highest of any month in the partnership through September.
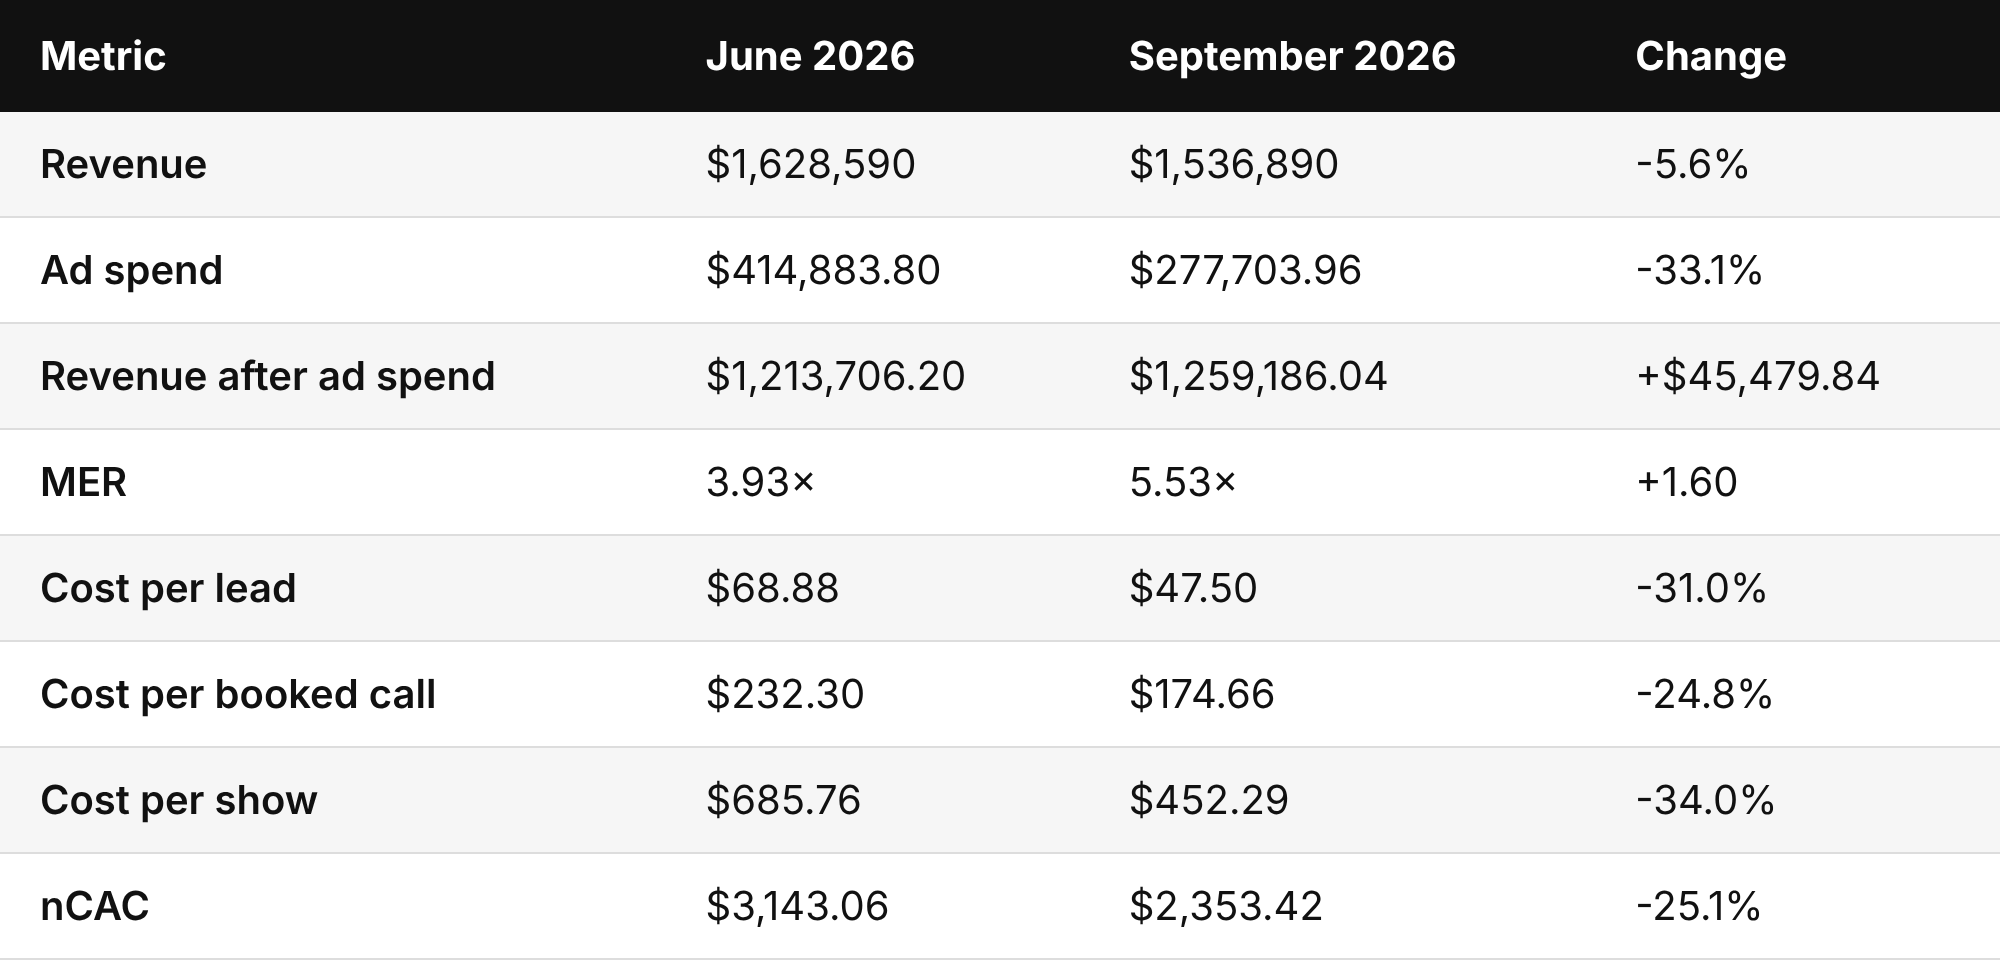

Spend, leads, cost per lead and cost per booked call across all paid channels, June to September 2026. Source: Tier 11 performance dashboard.
"Yeah, we're doing excellent on the month. People are crushing it right now… We've spent 138K on Facebook… we've generated $700K cash and $750K total client value."
The client's founder, mid-September 2026. Later on the same call: "We're, like, super profitable right now."
Why it worked: we managed the whole revenue system, not just the ad account
Scale and profitability do not only come from pushing more spend. They come from your messaging, how well you pre-frame people before asking them to book a call, your funnel, your show-up rate, how fast you get back to leads, and matching spend to what your sales team can handle.
Generating the lead is only half the job. The other half happens in the minutes after the form is submitted. Tier 11 looks at the whole picture, from the first impression to the closed deal. That is how we took this business from $1.0M to a $1.6M record month, and then kept it there profitably.
Is your ad spend outrunning your sales team?
If your revenue is growing but your cost per call keeps climbing, the answer may not be in the ad account. It may be in how fast your team gets back to the leads you are already paying for. We will show you where your pipeline is leaking and what your sales team can actually absorb.