How a “Google Problem” Can Be a Measurement Problem.
Share this post
A US-made off-road parts brand went from $5.5M to $12.1M in gross sales in 13 months. Tier 11 never touched the ad accounts. Our scope was consulting and the Tier 11 Data Suite™, and their own team ran the media the whole way through.
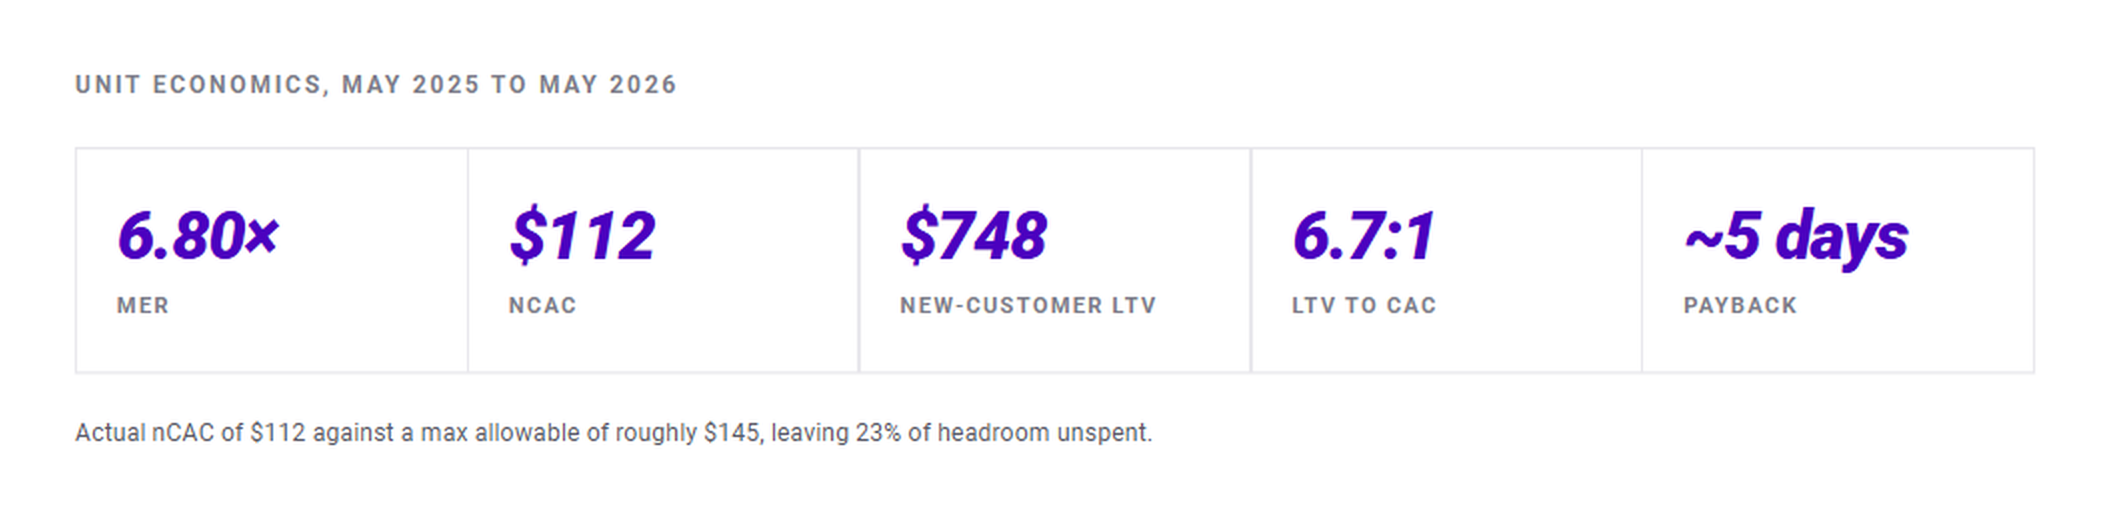
+120% gross sales · +86% new customers · $112 nCAC against a $145 ceiling · 6.80× MER
The result, first
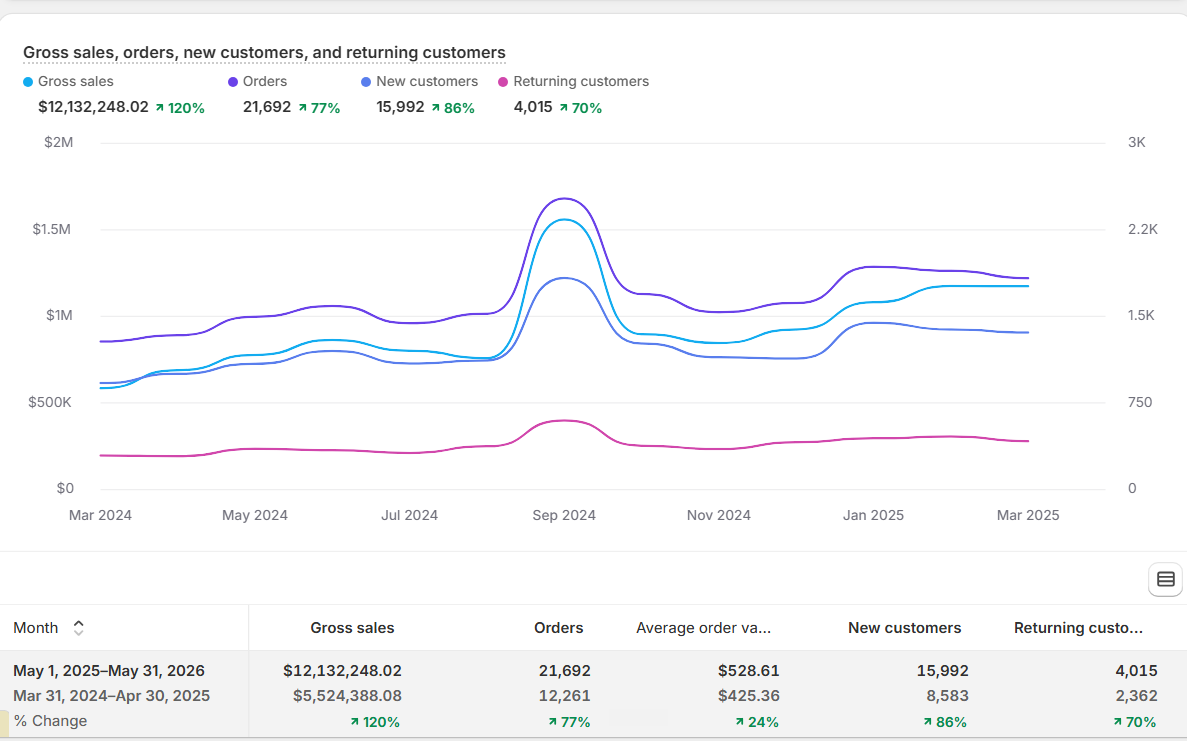
Revenue more than doubled, and it did not come from one spike. Volume, basket size, acquisition and retention all climbed in the same window, which is what durable growth looks like on a chart.
Gross sales, orders, new customers and returning customers. Source: Shopify, May 1 2025 to May 31 2026 against the prior 13 months. The comparison period sits entirely before the partnership began. Average order value is reported by Shopify on net sales; the headline figures are gross sales.
Monthly revenue averaged around $425,000 before the engagement. Black Friday 2025 cleared $1M for the first time, and recent months have held above it. Over the same period the client's own team grew from six people to ten.
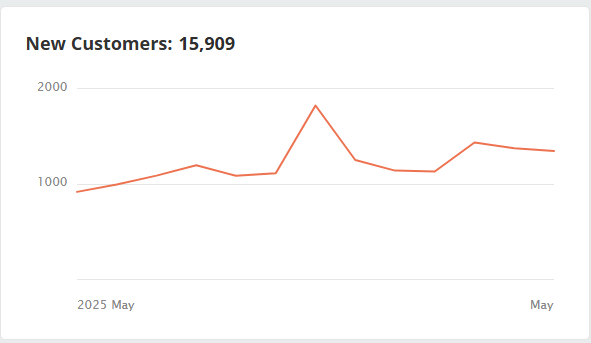
New customers by month. Source: Wicked Reports, which attributes slightly differently to Shopify.
“Now every month is a Black Friday month.”
The client, to their Tier 11 Growth Strategist.
The wall was not the one it looked like
The brand was running Google and Meta in-house, and running them competently. Google carried over 90% of the spend. In mid-2024 a Performance Max campaign ended and both sales and Google conversions dropped. The natural read was that the platform had shifted underneath them.
This was never a rescue. The goal was ambitious: scale spend 50 to 60 percent, consolidate two storefronts, and grow hard. What the business wanted from a partner was an answer to one question. How hard can we push?
That question did not have an answer yet, because the business had never had a working figure for what a new customer was worth.
We audited the revenue system before recommending anything
Shopify, Google and Meta, all three.
What the audit showed
No ceiling to spend against: nobody had established what a new customer was worth, so the safe move was always to hold back, and holding back was costing them growth.
No reliable source of truth: a 2020 Shopify migration had left the historical data inconsistent, and Meta showed inflated ROAS driven by view-through conversions, so neither platform could be checked against the other.
Repeat purchase weaker than it looked: roughly one customer in five came back, which reads like a functioning retention engine, but with no lifetime value curve nobody could say what that behaviour was actually worth.
Meta judged on the wrong job: measured on last click as a direct-response channel, when what it was actually doing was supporting Google.
And real problems in the Google account
Target ROAS on a lagging metric: the goal was set against a metric running on an eight-day reporting lag, so the account throttled itself. A campaign budgeted at $750 a day was spending $37.
A broken product feed: items ineligible for missing shipping values, and dozens of variants of the same product competing for placements Google could only learn from at item level.
Categories sitting dark: entire product categories were not running at all.
Real issues, all fixable, and none of them the reason the business could not scale.
The first thing we shipped was not a campaign
It was the Tier 11 Data Suite™. We repaired in-platform tracking and stood up an independent attribution layer in Wicked Reports, so every decision after that came from one unbiased view rather than from whatever each platform wanted to claim credit for. It also fed cleaner conversion data back to the platforms, which improved how their algorithms optimised.
From there, what we advised:
nCAC ceiling: the client calculated what the business could afford to pay for a new customer, working from lifetime value, cost of goods, refunds, fulfilment, operating expenses and the margin they wanted to protect. That single number turned “how hard can we push?” from a judgment call into arithmetic, and it became the primary metric for the partnership.
SKU selection: the Data Suite™ showed which products were actually acquiring new customers, not just generating revenue from returning ones. Budget moved behind those.
AOV optimization: identified the highest-AOV products and rebuilt campaigns around them. AOV grew from $425 to $529, a 24% lift on top of 77% more orders.
First-click reallocation: with attribution readable, it became clear which campaigns were creating customers rather than closing ones other campaigns had created. Spend followed.
Repeat purchase: once the lifetime value curve existed, the gap was measurable. Twelve months of repeat purchasing added only about 13% to what a customer was worth on day one, roughly $85 a head. Their team began building email sequences against that curve.
Profitable to scale, on a fully-loaded basis
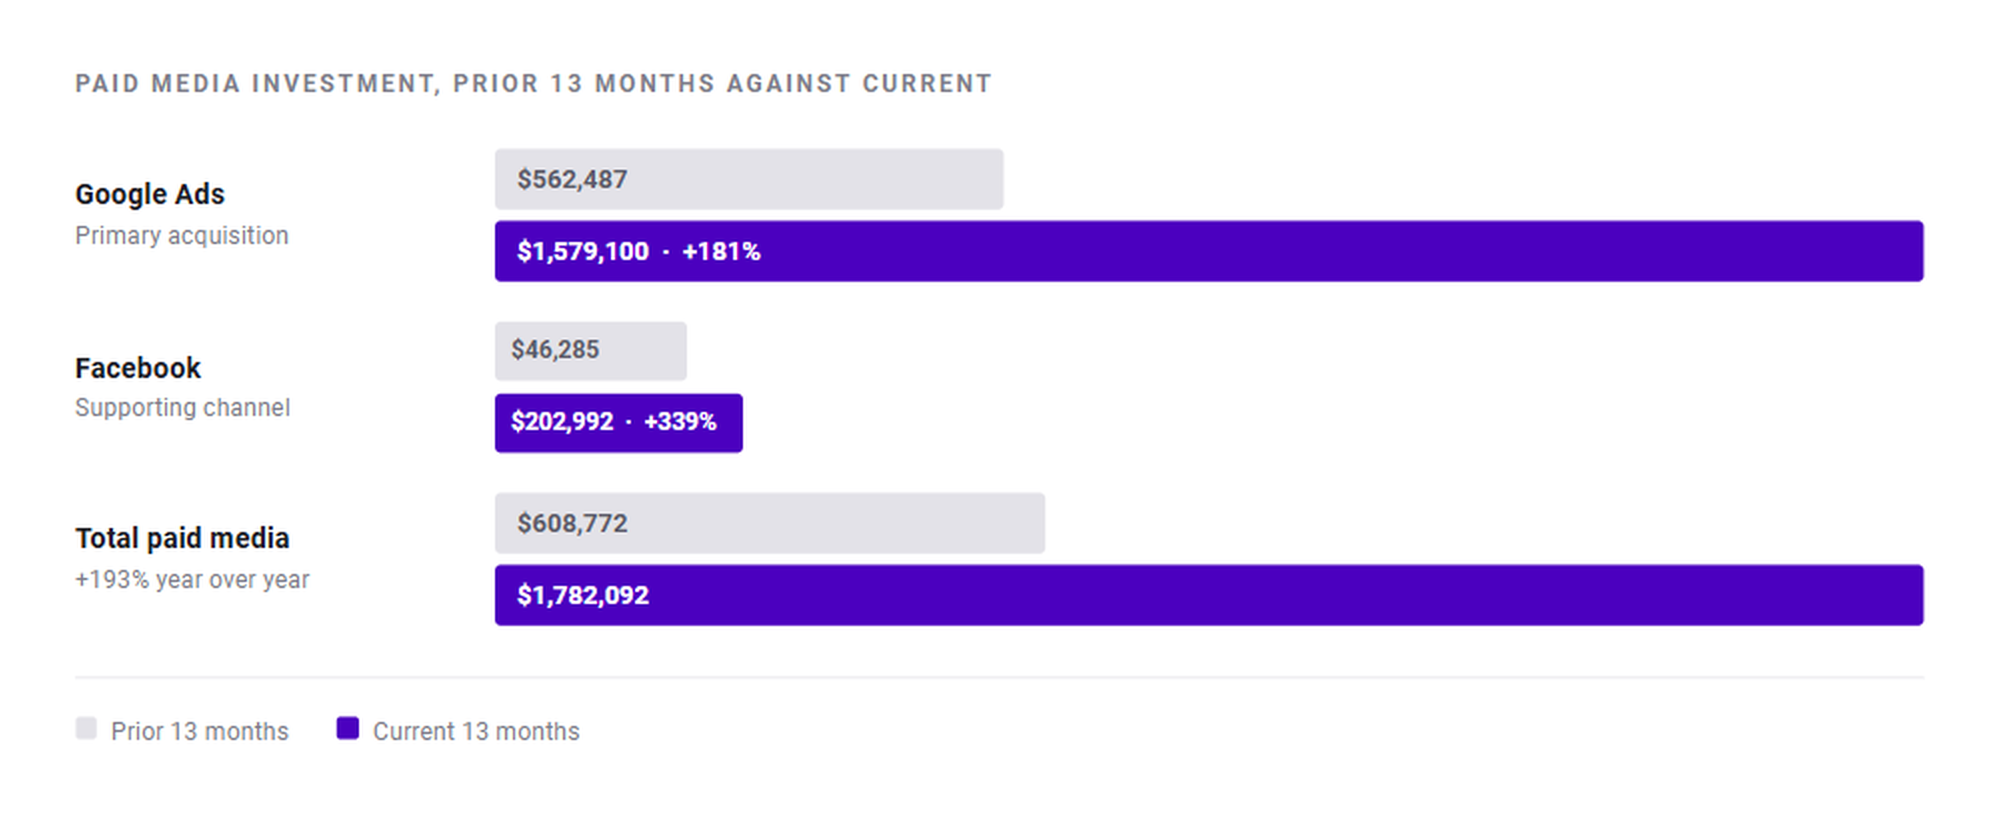
Once the ceiling existed, scaling stopped being a risk and became a decision. $1.78M in ad spend returned $12.13M in revenue.
Marketing efficiency ratio by month. Wicked reports 6.93 against attributed revenue; 6.80× above is the same spend measured against Shopify gross sales.
Investment scaled nearly 3×, and efficiency held
Most brands cannot scale spend at this rate without efficiency collapsing, because they cannot see which dollar is doing the work. Here the ceiling held while spend tripled.
Contribution is gross margin at 30% less paid media. Product cost and media only, not net profit.
Contribution after product cost and media grew from roughly $1.05M to roughly $1.86M, an increase of $810K or +77% year over year. Gross sales beat the prior year in every month of the window, peaking in November 2025 at $1.56M.
Why it worked: we consulted, they executed
The engagement was consulting and the Tier 11 Data Suite™. Their own team did the media buying the whole way through, on the same platforms, in the same accounts. A 120% revenue increase came out of measurement and strategy. Nothing about the execution changed except what it was aimed at.
Without a source of truth it is difficult to know what you can afford to spend on a new customer, which products actually attract them, and which channels create demand rather than claim credit for the final conversion. Once that foundation was in place, the strategy became obvious: a realistic acquisition ceiling, the products new customers actually wanted, and budget balanced between what acquires and what earns.
Do you know what you can afford to pay for a customer?
Most brands cannot answer that with a number. Until you can, you have no way of knowing whether you are overspending or leaving growth on the table, and no basis for deciding how hard to push.