
For five months straight, a premium pet ecommerce brand watched their dashboards report wins and their forecasts come in red. The in-platform metrics on Amazon and Google Brand looked fantastic. New customers kept dropping. Spend kept rising.
A problem in one place shows up as a symptom somewhere else. The symptom was missed forecast. The problem was attribution.
We ran a Growth Diagnostic, cut bottom-funnel spend 91%, and reallocated to top-of-funnel demand creation. The result: 44% revenue growth, nCAC down from $193 to $109, and four consecutive forecast hits after five straight misses.
Ralph Burns and Scott Desgrosseilliers (Wicked Reports) walk through every move, including the data we used to defend a 91% Amazon cut to the client.
Before partnering with Tier 11, the brand was spending heavily on Google Brand, Bing Brand, and Amazon Sponsored. Every dashboard told them the spend was working. The business told them otherwise.
This is the trap most performance-led brands hit between $10M and $100M: the platforms grade their own homework. They all give themselves an A+. The CFO sees a forecast miss and asks why.
Tier 11 took over the full omnichannel strategy and stopped trusting platform-reported numbers. We replaced modeled attribution with a single source of truth: the Tier 11 Data Suite paired with Wicked Reports for click-based multi-touch attribution. From there, every decision was made against one metric, cost per new customer (nCAC), measured as Cost Per Unit (CPU).
The hypothesis: the channels with the highest in-platform ROAS were charging premium prices for clicks the brand had already paid to create elsewhere.
We tested it. Cut Amazon Sponsored 50%, watched units hold within range, and cut again. Four times. Total reduction from roughly $50K to under $5K per month, a 91% cut. Amazon revenue actually grew 33%.
Same playbook on Google Brand. A 95% spend cut dropped clicks only 17%. The traffic was going to convert anyway.

Every dollar pulled from harvesting channels was redirected upstream:
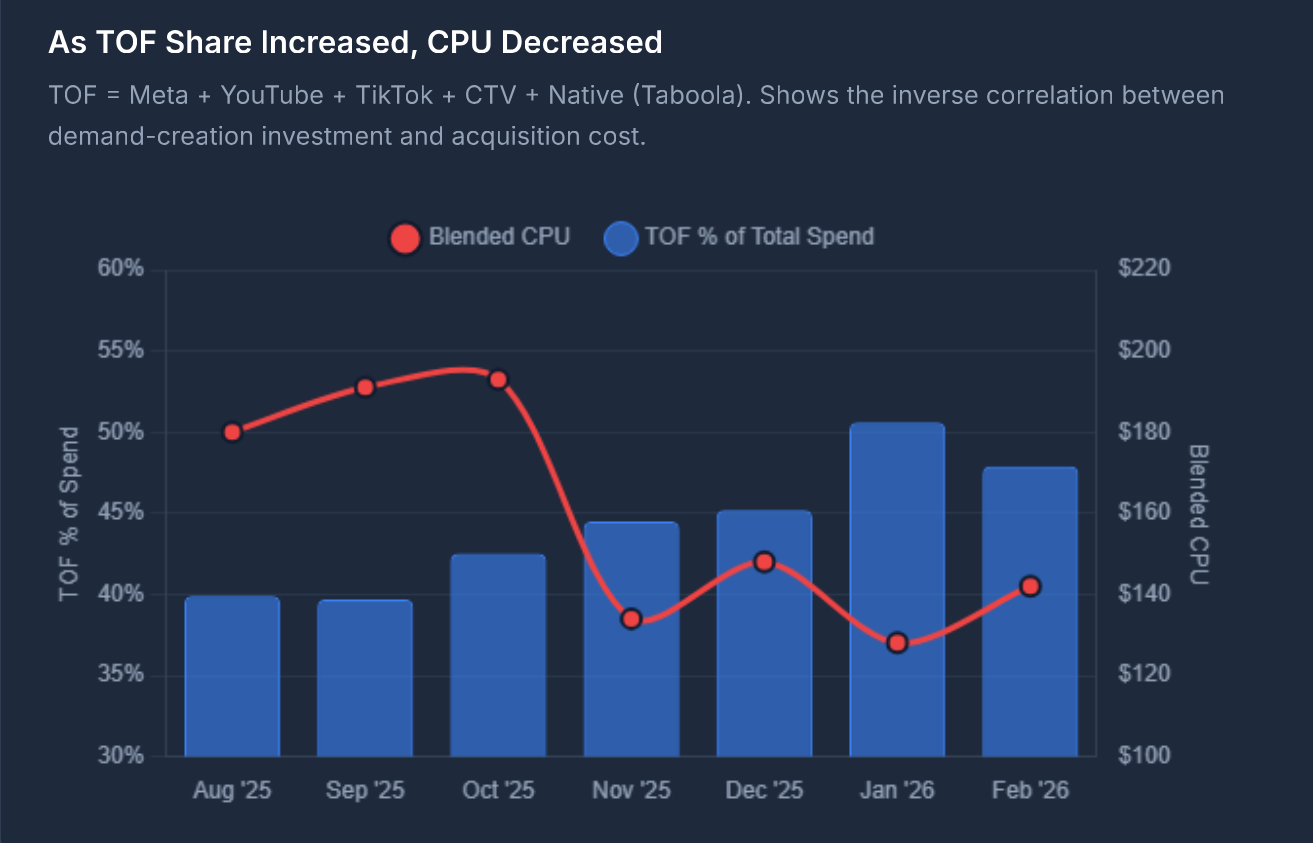
Top-of-funnel investment climbed from ~40% to over 50% of total spend.
Inside the Tier 11 Data Suite, every channel's contribution is now measured the same way: net-new visits, eCPNV, real revenue, blended efficiency. No platform marking its own homework. No modeled guesses.
That's attribution we can defend in a boardroom.
When you create real demand at the top of the funnel, the entire ecosystem moves with it. None of these channels got additional budget:
Google and Bing were restructured from ~20% non-brand to ~80% non-brand. Email and direct revenue both grew without dedicated spend.
What was on the roadmap is now in market. Last month we layered Connected TV on top of the Native Advertising already running on Taboola and Outbrain, putting the brand in front of streaming audiences across FUBO, Netflix, and the rest of CTV inventory. Same offer. Same Data Suite. New top-of-funnel reach, coordinated with everything already running.
30 days in, against the prior 30 days with no CTV:
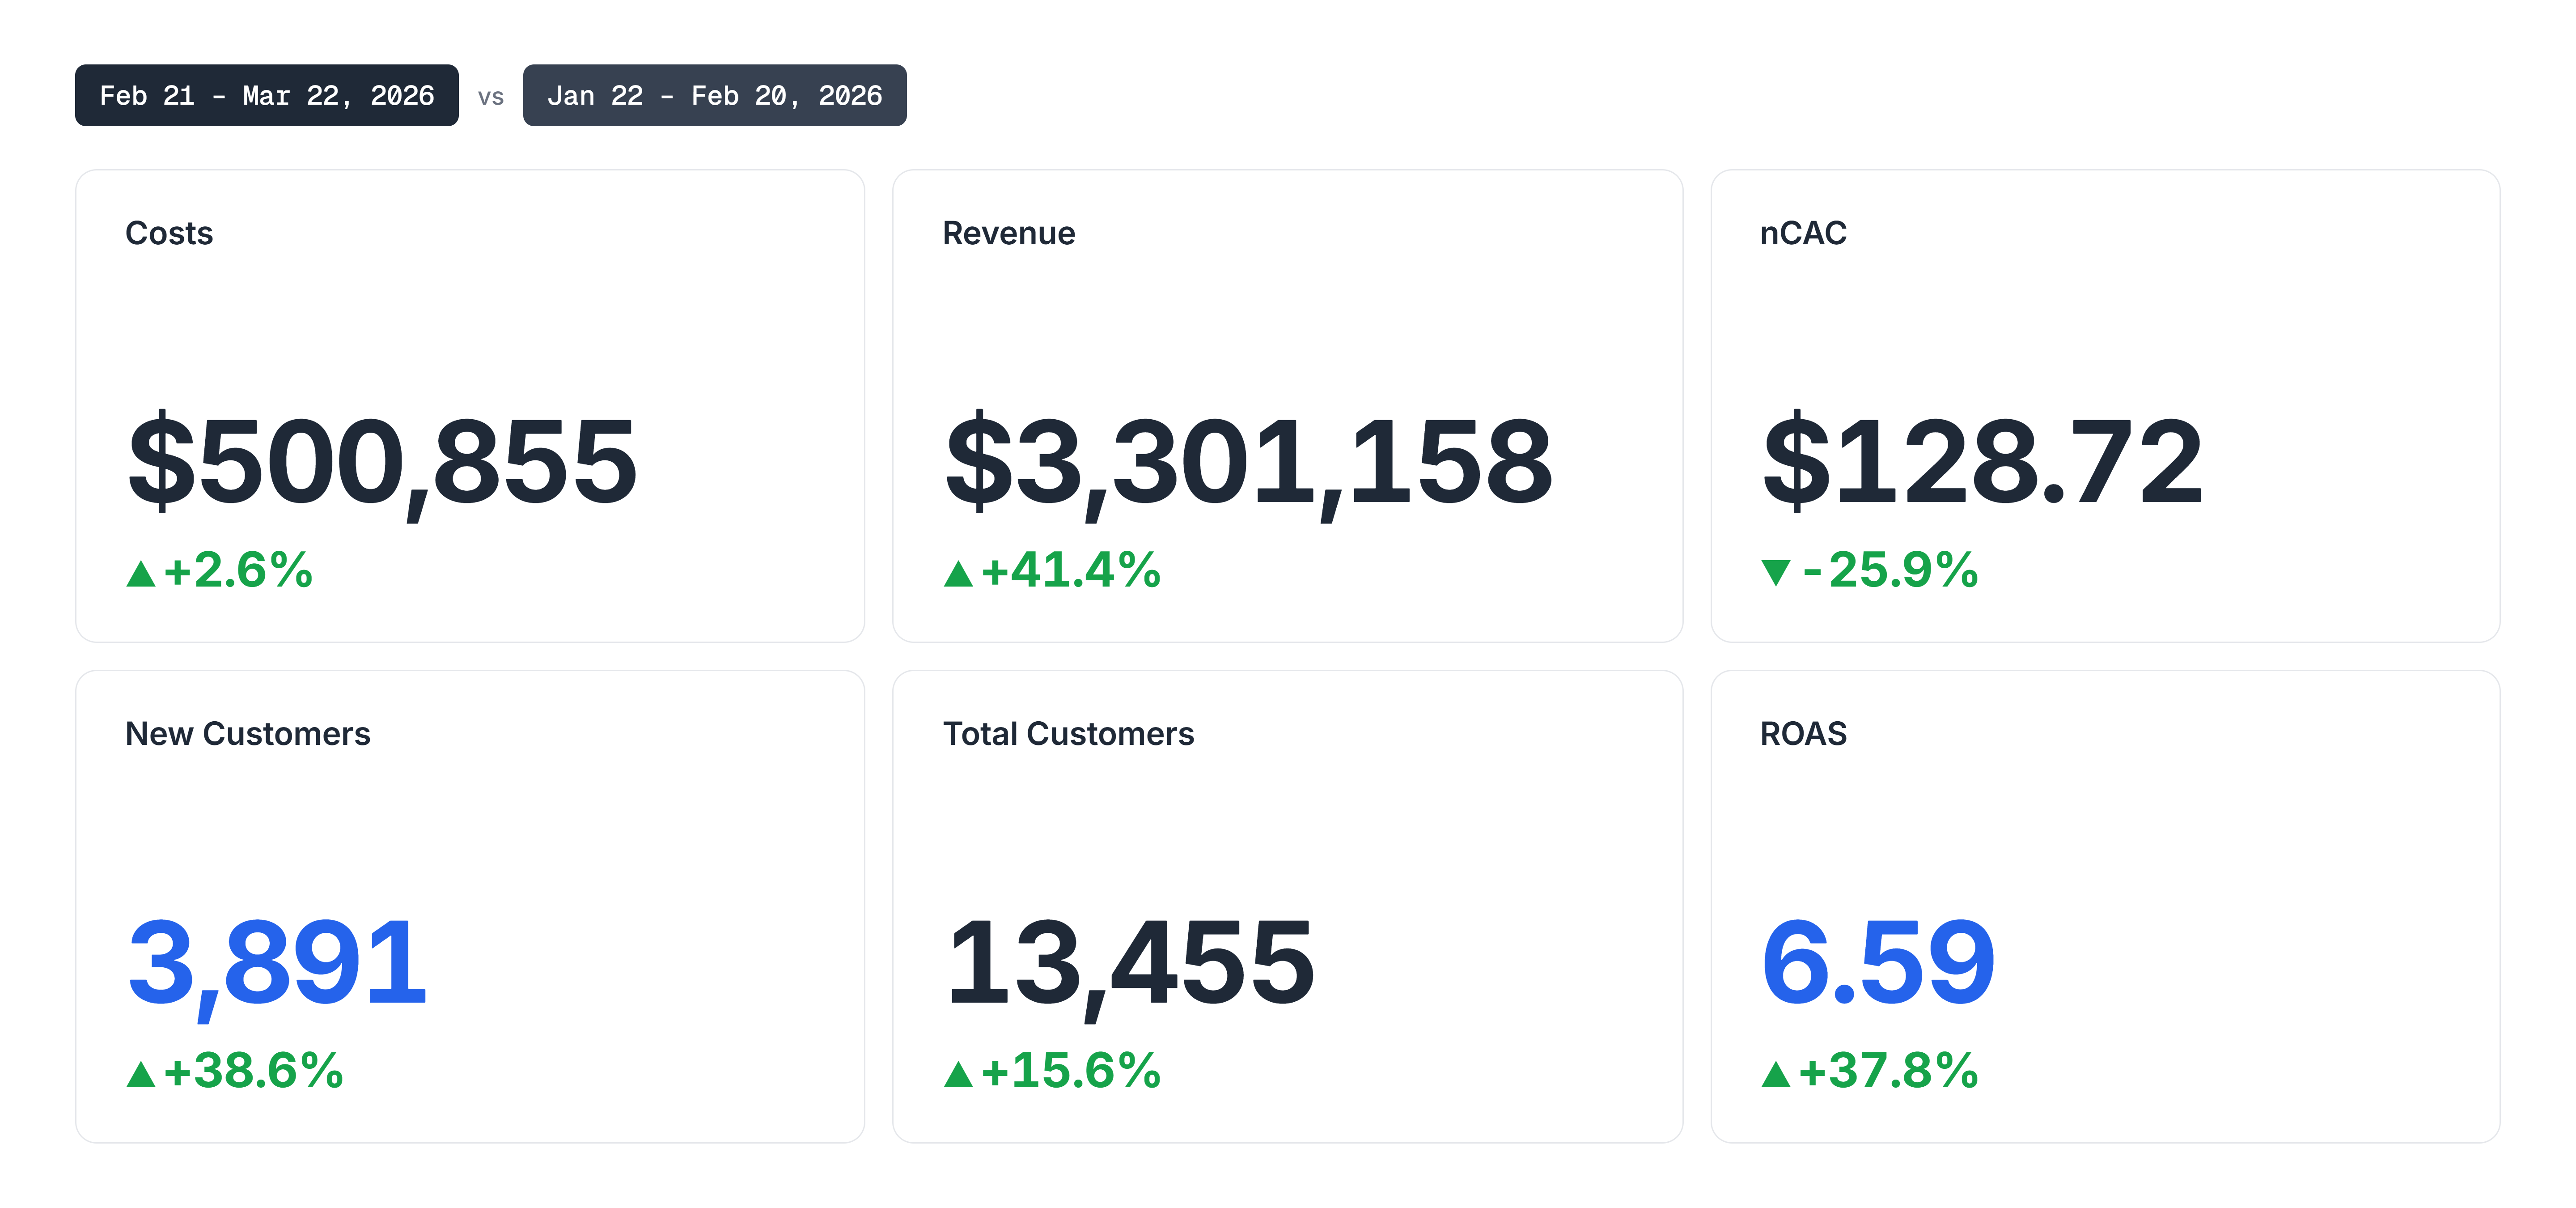
Connected TV ramped from $0 to $35,299 in one month, a 166% spend increase, and the Programmatic block as a whole grew alongside it. Connected TV does not deliver clicks. It delivers view-through awareness. The lift shows up exactly where it should: downstream, in the channels that close. Every channel performed better because they were running together, under one strategy, inside one tracking ecosystem.
Repeat-customer behavior moved too. One campaign inside the Programmatic block lifted repeat customer count by 450% during the window, which tells us the awareness layer is reactivating known buyers, not just acquiring new ones. That second-order effect is the kind of signal you only see when every channel is tracked in one place.
.png)
Repeat-customer behavior moved too. One campaign inside the Programmatic block lifted repeat customer count by 450% during the window, which tells us the awareness layer is reactivating known buyers, not just acquiring new ones. That second-order effect is the kind of signal you only see when every channel is tracked in one place.
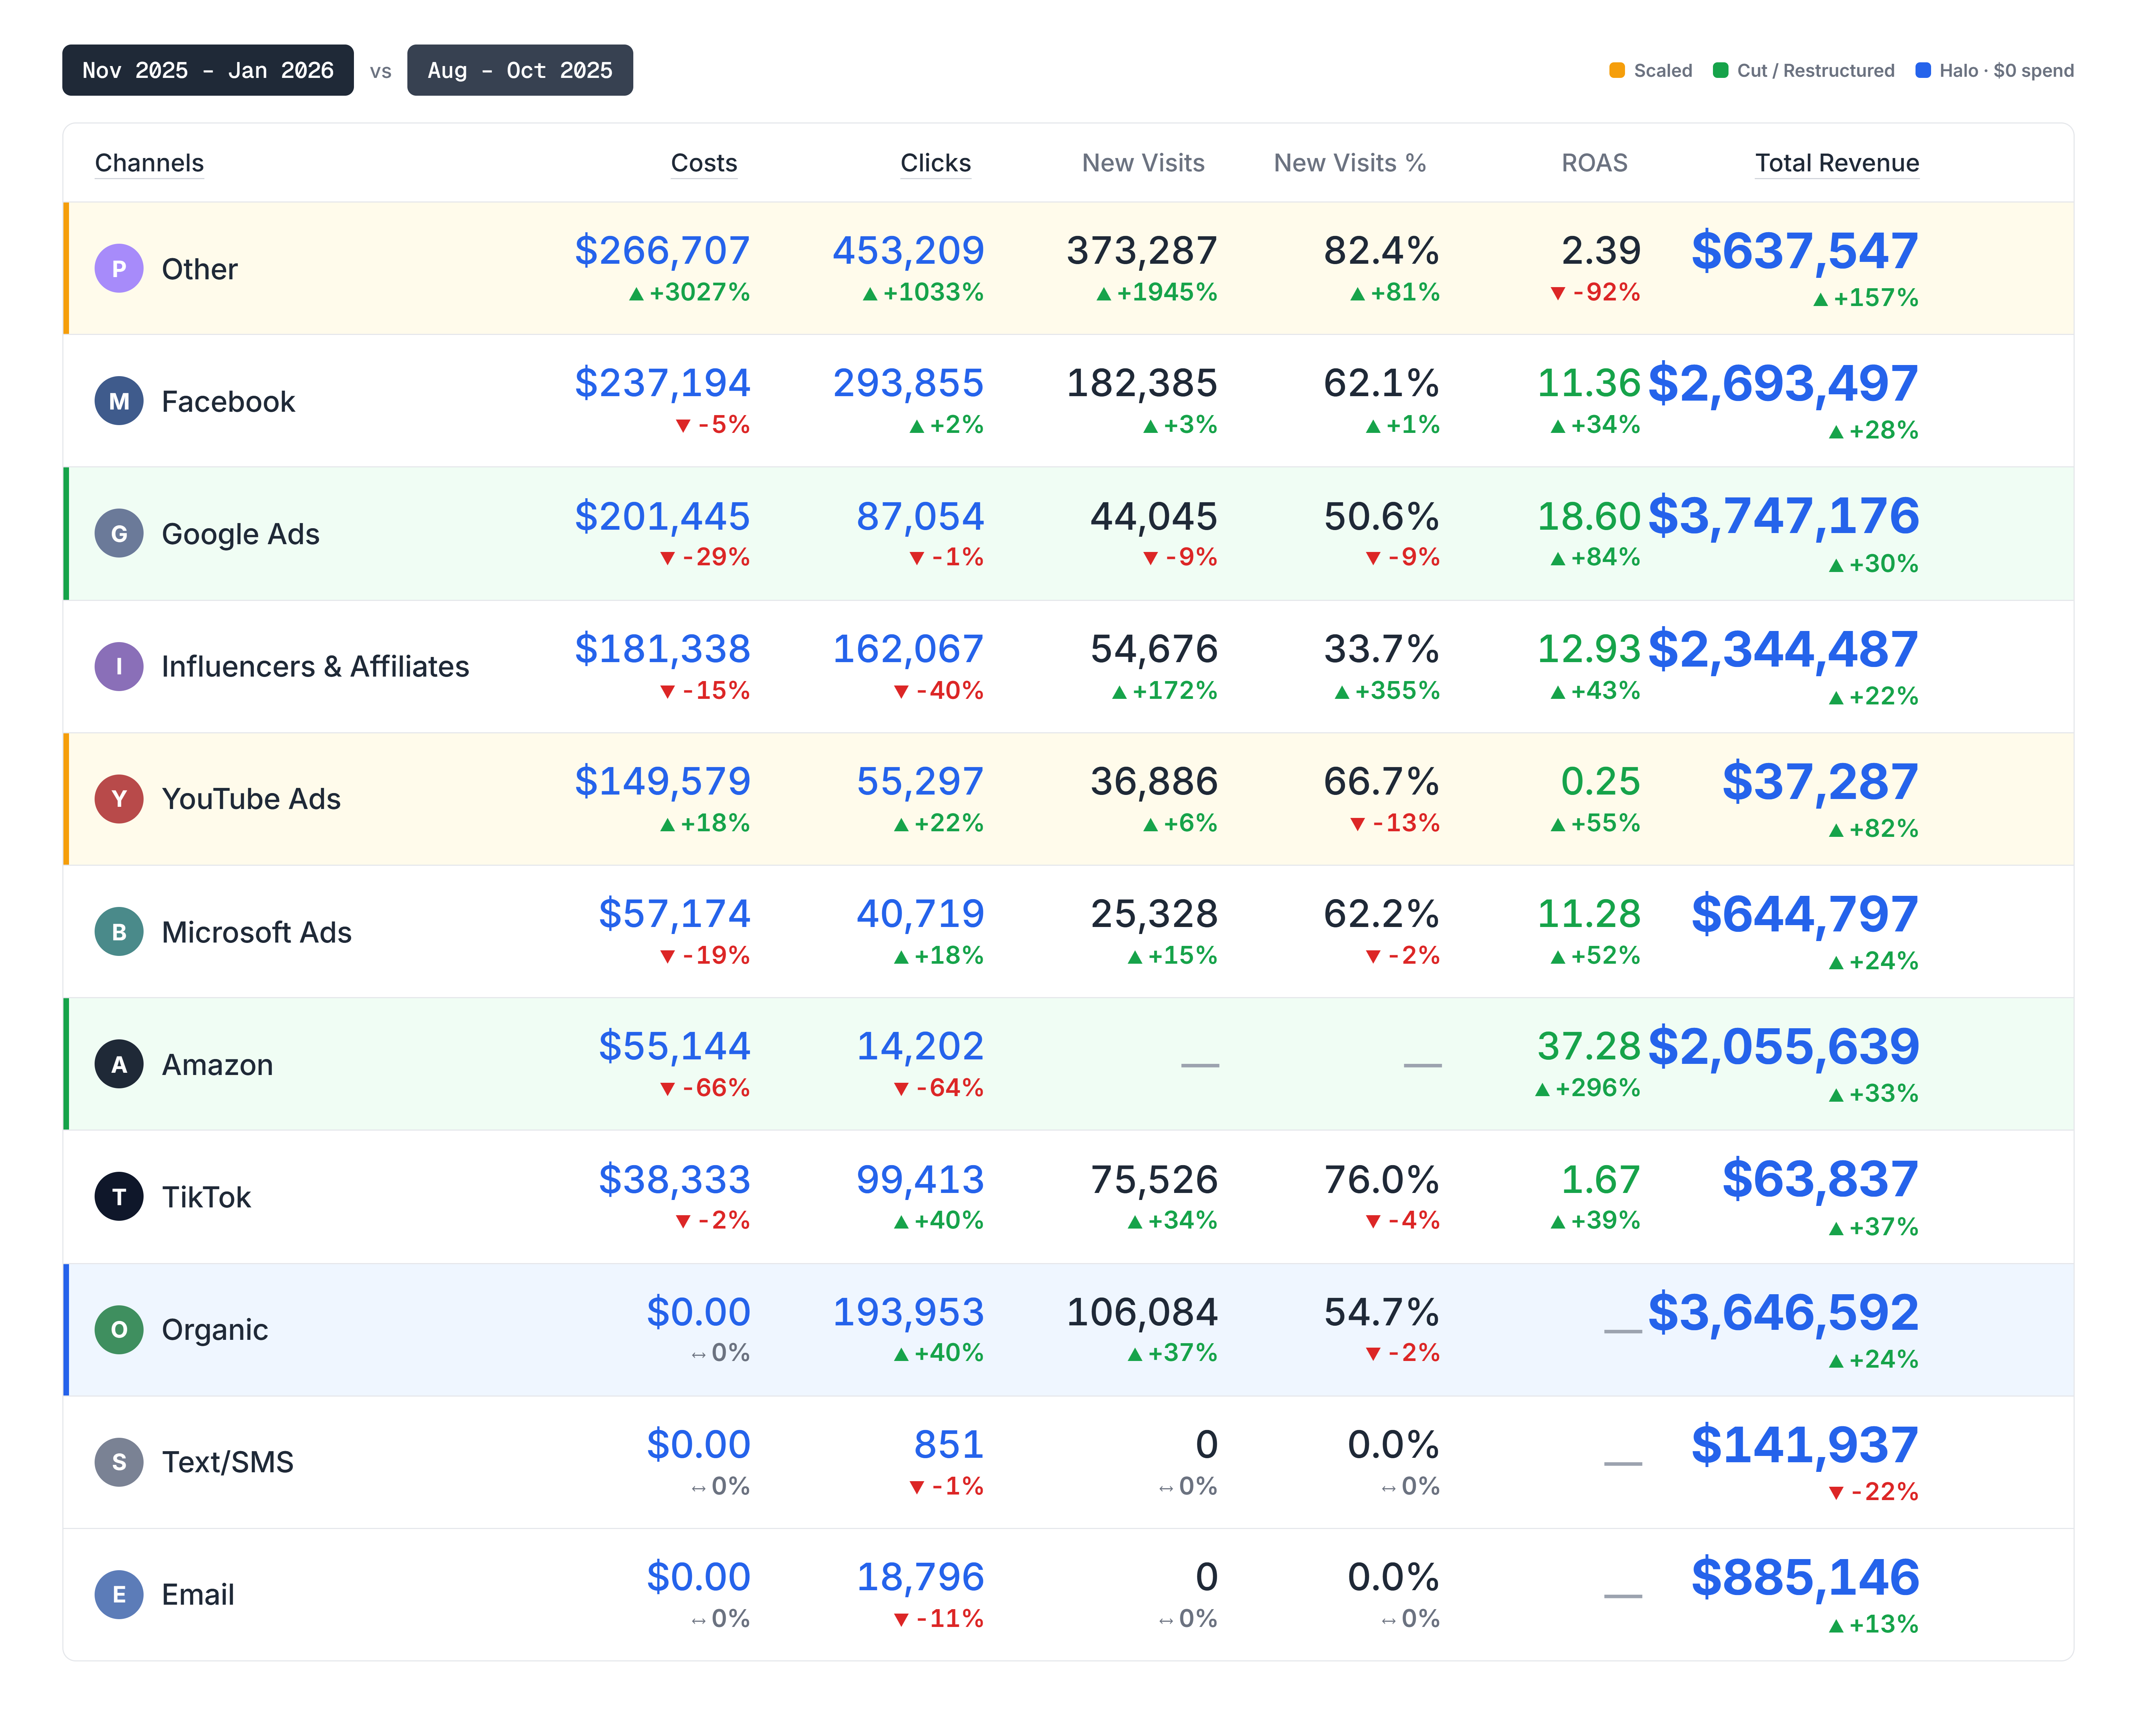
Pull the lens back to when Native first went live last November, and the channel mix tells the rest of the story. Facebook revenue is up 28% on lower spend. Google up 30% on a 29% spend cut. Amazon up 33% on 66% less spend. Organic up 24% with zero dollars behind it. Almost every channel grew while its budget shrank or held flat, because the awareness layer is feeding them. When Programmatic runs cohesively with the Conversion Engine, with DSP buying, Connected TV, and Native all under one roof and visible in the Data Suite, the system compounds. That visibility is what makes scaling it the right move, not a risky one.
Connected TV is no longer the next move. It is in market and already pulling. From here, we keep widening the awareness layer, deepening Native placements, and feeding the Data Suite the inputs it needs to keep telling us where the next dollar belongs.
Most brands at your spend level are paying to re-buy customers they already had. We'll show you which channels are actually creating new revenue, and which are just taking credit.
For D2C brands spending $30K+/month on ads.